2000issue C021-5
Continuation triangles as a three-lock experiment
A historical continuation workflow draws converging supply and demand lines through isolated pivots, waits for a higher-timeframe trend to choose the break side, and keeps the stop on the opposite line until the same average can trail the position.
- A triangle is outlined by a supply line through isolated highs and a demand line through isolated lows, and those two lines must converge when extended.
- The pattern is complete only after a fourth isolated pivot: a later isolated low that stays above the first, following a second isolated high that does not exceed the first.
- Continuation treatment pairs the daily-bar triangle with a rising higher-timeframe average before a break of either line is treated as the working hypothesis.
- The initial stop sits beyond the opposite line; after the entry is profitable and that same average has moved through the entry price, the average can replace the stop as a trailing exit.
A narrowing range used as continuation
A triangle is outlined with a supply line through isolated highs and a demand line through isolated lows. Those two lines must converge when extended. In this archive workflow the narrowing range is treated as a continuation setup rather than a reversal call.
Isolated highs and isolated lows
Isolated highs and isolated lows are three-bar attempts to push in one direction, with the middle bar holding the extreme used to locate resistance and support.
An isolated high is a three-bar push higher in which the middle bar holds the peak. That peak becomes a resistance reference for the supply line. An isolated low is a three-bar push lower in which the middle bar holds the trough. That trough becomes a support reference for the demand line.
The supply line is the upper boundary of the triangle, drawn through successive isolated highs. It may be flat or descending, and it marks the level whose penetration is treated as the continuation entry. The demand line is the lower boundary, drawn through successive isolated lows. It may be flat or rising, and it marks the level used for the initial protective stop.
When the fourth point appears
The pattern is not complete until a fourth point appears. That point is a later isolated low that stays above the first isolated low, after a second isolated high that does not exceed the first.
A stated timing heuristic is that price often leaves the pattern about two-thirds of the way from the first isolated high to the projected meeting of the two lines.
The higher-timeframe trend filter
Continuation use pairs a daily-bar triangle with a higher-timeframe trend filter, illustrated as a rising eight-week moving average, before a break of either line is treated as the working hypothesis.
That filter decides whether the daily-bar triangle is treated as continuation and which side is favored. The archive illustration uses a rising eight-week average and leadership versus the broader list.
Sun Microsystems daily bars and eight-week moving average, early 1999
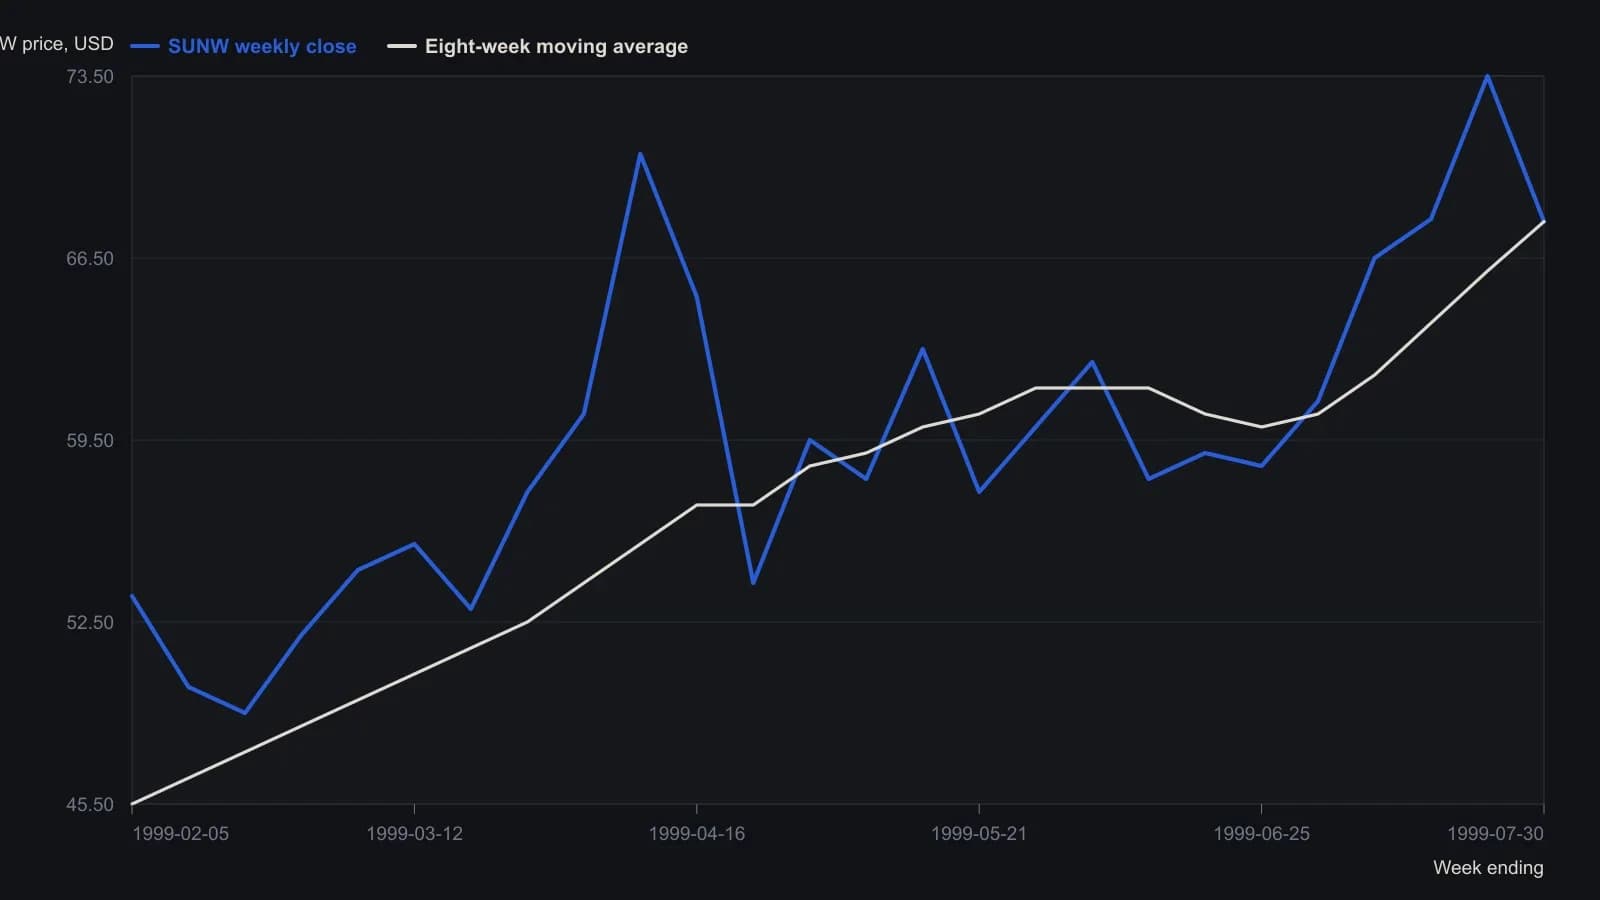
The source plots daily OHLC bars with an eight-week simple moving average in step formation from Friday closes. Weekly closes and the matching step of the average were read from the raster; intraweek highs and lows are not claimed.
Entry, initial stop and the later trail
The October case defined entry as a penetration of the supply line and placed the initial stop below the demand line.
After the entry is profitable and the eight-week moving average has moved above the entry price, that average can replace the initial stop as a trailing exit. The archive trailing stop is therefore two-stage: the initial stop sits beyond the opposite triangle line, then migrates to the higher-timeframe moving average once that average has risen through the entry price.
Measured objective and failed continuation
A measured objective is formed by taking the widest height of the triangle and projecting that distance from the apex, after which a partial reduction of the position can be considered.
Continuation-pattern failures are treated as an early warning that a larger correction may be developing. Successful continuation resolutions are treated as evidence that the broader advance remains intact.
All readings on this track · 33 readings
- 1986Gold as a double zigzag before a contracting B-wave triangle
- 1990Scoring competing wave counts after a crash
- 1992Pre-trade checklist for trendline and triangle signals
- 1995Chart patterns as tactics, not strategy
- 1996Constructing Elliott wave counts with triangles and Fibonacci
- 1996A price-channel case study with a pending triangle signal and a planned stop-loss
- 1996Expanding triangle as a dual-label fourth-wave reversal worksheet
- 1997Rising wedge construction, breakout, and volume
- 1997Confirm structure and conditions before naming a Triangle pattern
- 1999Drawing the Triangle pattern before Breakout confirmation and the Stop-loss order
- 2000Four-phase market cycle triangle breakouts
- 2000Continuation triangles as a three-lock experiment
- 2001Folding rule: stacking three trendlines on an accelerating swing
- 2003A scored symmetrical triangle on a utility stock
- 2003Constructing wedges versus flat-boundary triangles
- 2004Testing triangle breakouts against volume filters
- 2004Mute triangles, histogram force, and trader optimization
- 2004Constructing falsifiable reversal and continuation patterns
- 2004Construct a corrective rising wedge before treating it as a short
- 2004A continuation triangle with Fibonacci targets and an apex stop
- 2005Pre-breakout filters for classic chart patterns
- 2005Reverse trendlines as a geometry lab for convergence and expanding triangles
- 2005Volume shapes versus triangle and double-pattern breakouts
- 2005A nested-pattern checklist on the 2005 euro
- 2005Volume test for a descending triangle breakout
- 2010Constructing triangle, broadening, and head and shoulders patterns
- 2011Treat a numeric pattern rank as a shortlist
- 2011Evaluating the head-and-shoulders as a falsifiable reversal
- 2013Auditing chart patterns by the first post-breakout swing
- 2014A three-gate entry for a triangle pullback
- 2014Golden triangle: a 50-day pause that still needs both gates
- 2014The triangle qualifier came after the rating pre-screen and the fifty-day bounce
- 2018Aligning daily, weekly, and monthly triangles with trendlines and Fibonacci retracements