2004issue C121-4
A continuation triangle with Fibonacci targets and an apex stop
The archive treats triangles and wedges as continuation consolidations that narrow toward an apex. A breakout can serve as the entry, Fibonacci ratios of midpoint height mark planned exit zones, and the initial stop sits just beyond the apex on the side opposite the entry, independent of the fill.
- Triangles and wedges are treated as continuation consolidations, so a breakout can serve as the entry and a Fibonacci-ratio calculation as the planned exit zone.
- Triangle boundaries come only from pivot highs and pivot lows. A possible setup is noted once each line has at least two touches and the slopes oppose each other.
- The initial stop-loss sits just beyond the apex on the side opposite the entry and is not tied to the fill price.
- Midpoint height, taken at 50 percent of the elapsed time from the longest side to the apex, scales the 61.8 percent, 100 percent, and 1.618 extension zones from the ideal entry.
Contraction that narrows toward an apex
Price action is framed as alternating range contraction and range expansion. A common triangle is described as a contraction that narrows toward an apex, the projected intersection of the two triangle boundaries.
The triangle is a narrowing consolidation drawn from opposing pivot-high and pivot-low boundaries. It is treated as a range contraction that can resolve into a new expansion phase. Triangles and wedges are treated as continuation consolidations: a breakout can serve as the entry and a Fibonacci-ratio calculation as the planned exit zone.
Boundaries from pivot highs and pivot lows
Triangle boundaries are drawn only from pivot highs and pivot lows. A pivot high is a bar whose high is higher than the highs of the bars immediately before and after it, and it is used as a valid upper-boundary touch. A pivot low is a bar whose low is lower than the lows of the bars immediately before and after it, and it is used as a valid lower-boundary touch.
A possible setup is noted once each line has at least two touches and the slopes oppose each other. A preferred formation has three touches on one line and two on the other. A third-touch bar that pierced the upper line without exceeding the prior upper pivot high was used as a clue that the breakout would be upward.
Entry, apex stop, and Fibonacci exit zones
In the cocoa illustration, after the third-touch high printed 1490, the long entry stop was set five ticks higher at 1495.
The initial stop-loss is a protective order placed just beyond the apex on the side opposite the entry. In the long example that level was 1464. The stop is not tied to the fill price.
Midpoint height is the vertical price distance between the two triangle boundaries at the halfway point in time from the longest side of the formation to the projected apex, which is 50 percent of the elapsed time from the longest side to the apex. That height was 39 points in the example.
A Fibonacci overlay scales that midpoint height by Fibonacci ratios to mark 61.8 percent, 100 percent, and 1.618 extension exit zones from the ideal entry. The 100 percent target adds one midpoint height to the ideal entry (1495 plus 39 equals 1534). The 1.618 extension is 1495 plus 39 times 1.618, or about 1558. Charts also mark a 61.8 percent zone.
Trailing the stop after the base extreme
After price trades above the highest high of the triangle base (1519), the long stop is moved to just below the entry-bar low (1484).
The plan is presented as entering at the end of contraction and exiting during expansion, without requiring a forecast of where the session will finish.
May 2004 cocoa: apex stop and Fibonacci targets
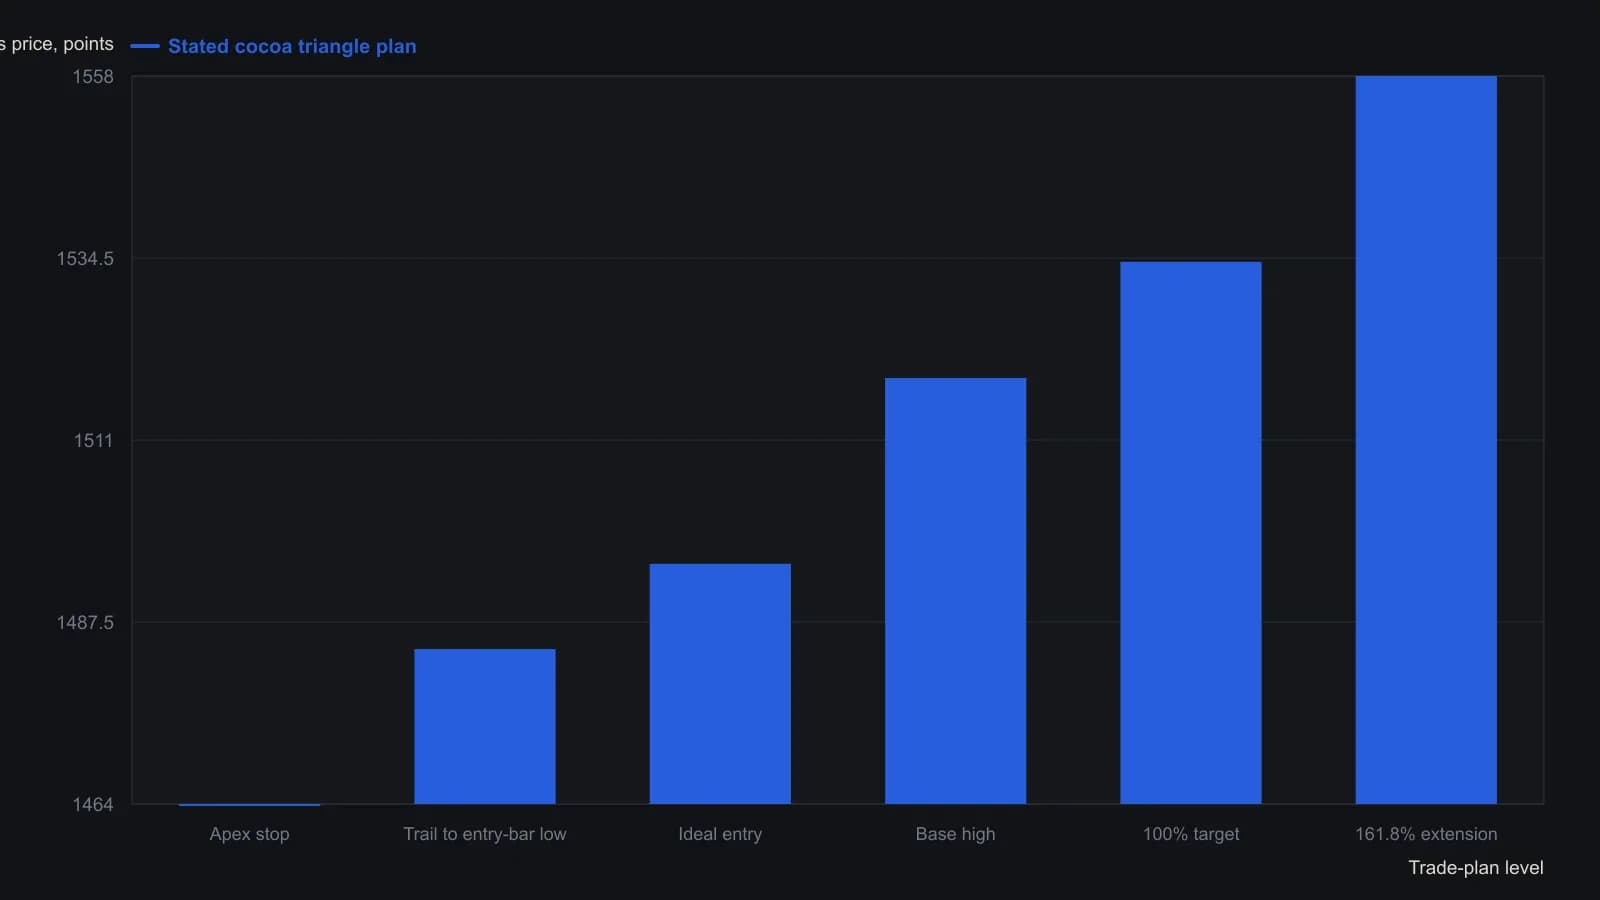
Midpoint height is fixed at 39 points on 46-minute May 2004 cocoa. The initial stop sits beyond the apex and is independent of the 1490 fill. The 161.8 percent extension is the article's approximate figure from 1495 + 39 × 1.618.
All readings on this track · 33 readings
- 1986Gold as a double zigzag before a contracting B-wave triangle
- 1990Scoring competing wave counts after a crash
- 1992Pre-trade checklist for trendline and triangle signals
- 1995Chart patterns as tactics, not strategy
- 1996Constructing Elliott wave counts with triangles and Fibonacci
- 1996A price-channel case study with a pending triangle signal and a planned stop-loss
- 1996Expanding triangle as a dual-label fourth-wave reversal worksheet
- 1997Rising wedge construction, breakout, and volume
- 1997Confirm structure and conditions before naming a Triangle pattern
- 1999Drawing the Triangle pattern before Breakout confirmation and the Stop-loss order
- 2000Four-phase market cycle triangle breakouts
- 2000Continuation triangles as a three-lock experiment
- 2001Folding rule: stacking three trendlines on an accelerating swing
- 2003A scored symmetrical triangle on a utility stock
- 2003Constructing wedges versus flat-boundary triangles
- 2004Testing triangle breakouts against volume filters
- 2004Mute triangles, histogram force, and trader optimization
- 2004Constructing falsifiable reversal and continuation patterns
- 2004Construct a corrective rising wedge before treating it as a short
- 2004A continuation triangle with Fibonacci targets and an apex stop
- 2005Pre-breakout filters for classic chart patterns
- 2005Reverse trendlines as a geometry lab for convergence and expanding triangles
- 2005Volume shapes versus triangle and double-pattern breakouts
- 2005A nested-pattern checklist on the 2005 euro
- 2005Volume test for a descending triangle breakout
- 2010Constructing triangle, broadening, and head and shoulders patterns
- 2011Treat a numeric pattern rank as a shortlist
- 2011Evaluating the head-and-shoulders as a falsifiable reversal
- 2013Auditing chart patterns by the first post-breakout swing
- 2014A three-gate entry for a triangle pullback
- 2014Golden triangle: a 50-day pause that still needs both gates
- 2014The triangle qualifier came after the rating pre-screen and the fifty-day bounce
- 2018Aligning daily, weekly, and monthly triangles with trendlines and Fibonacci retracements