2003issue C031-5
A scored symmetrical triangle on a utility stock
A 2001 utility-stock walkthrough treats a symmetrical triangle as a ranked hypothesis. Confirm the shape on a readable scale, apply a short scorecard, and let a later head-and-shoulders breakout test the exit.
- A valid symmetrical triangle shows lower highs and higher lows, trendlines that meet at a future apex, and at least two distinct touches on each line.
- Volume typically recedes toward the breakout, and premature breakouts are common near 70% of the way to the apex.
- A five-minute scorecard ranks setups instead of dictating the trade plan.
- On the utility chart, a logarithmic scale made two large triangles readable, and a later head-and-shoulders neckline break supplied the exit test.
A scored hypothesis, not a forecast
Editorially, TradersWeek treats a symmetrical triangle as a scored hypothesis rather than a forecast. The first job is to confirm the triangle-pattern on a scale that keeps the structure readable. A short scorecard then decides whether the setup is worth a long-side case study, while a later head-and-shoulders breakout becomes the exit test.
The archive facts describe that historical workflow. They do not tell a trader what to do in a present-day market.
What counts as a valid triangle
A triangle-pattern is a contracting price range bounded by a downward-sloping upper trendline and an upward-sloping lower trendline that meet at an apex. A valid symmetrical triangle is identified by lower highs and higher lows whose two sloping trendlines meet at a future apex, with at least two distinct minor-high and minor-low touches on each line. Prices that merely pierce a trendline do not count as touches.
What the reviews described
Volume in a typical symmetrical triangle recedes toward the breakout. A breakout is a close outside a pattern boundary that is used to confirm direction and to start measuring the subsequent move. A premature-breakout is a close outside a triangle trendline that quickly returns inside the pattern before the apex.
Upward premature breakouts occur 14% of the time and downward ones 19%, usually near 70% of the way to the apex. Breakouts usually continue the prior trend and typically occur just shy of 80% of the distance from the first touch to the apex. Patterns last at least three weeks and average about two months. In one 255-triangle review, 64% of symmetrical triangles acted as consolidations and 36% as reversals.
A scoring system built from 661 symmetrical triangles, including 365 with upward breakouts, is applied in about five minutes to rank setups rather than to dictate the trade plan.
Make the structure readable first
A logarithmic-scale is a vertical price scale that keeps large yearly ranges from compressing chart patterns into unreadable squiggles. On a 2001 utility-stock chart, switching from an arithmetic to a logarithmic scale made two large symmetrical triangles readable, and the later pattern was spotted two days after its breakout.
The March 2001 triangle showed four top touches and three bottom touches, while the October 2001 triangle showed five touches.
The long-side case and the exit test
In the worked example, the long was filled at 35.10 with an old-high upside of 39 and a 9% downside if the 32 support failed. The stock later formed another upward-breaking triangle in January 2002.
A head-and-shoulders is a three-peak reversal structure whose neckline break is treated as the sell confirmation after an advance. A head-and-shoulders top that began in April 2002 produced the exit when price dropped through round-number support near 40 and pierced a neckline near that same level, with the sale filled at 39.52.
After the sale, price pulled back into the 38 to 39 support zone, recovered to 41, then fell to just over 30. The scorecard had implied a move toward 44.55 from the breakout, while the actual high was 42.68.
WPS Resources in 2001: two symmetrical triangles
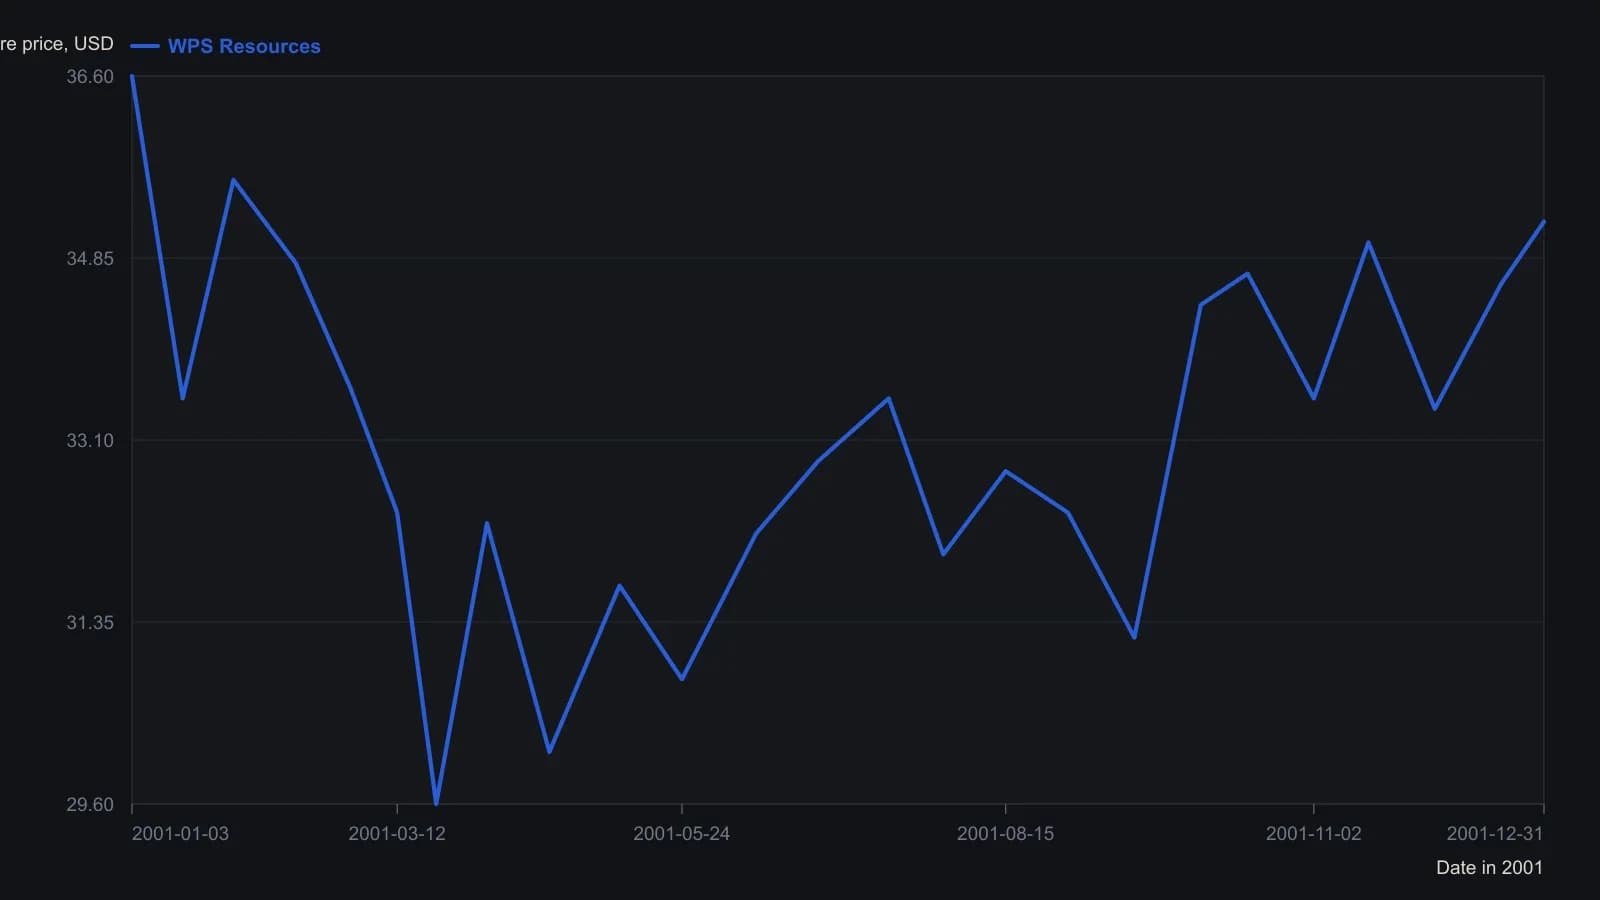
Daily bars were sampled about every two weeks; the raster cannot support tick-level closes. Volume is omitted because it uses a separate scale. Semilog vs arithmetic is a display choice and was not reconstructed.
All readings on this track · 33 readings
- 1986Gold as a double zigzag before a contracting B-wave triangle
- 1990Scoring competing wave counts after a crash
- 1992Pre-trade checklist for trendline and triangle signals
- 1995Chart patterns as tactics, not strategy
- 1996Constructing Elliott wave counts with triangles and Fibonacci
- 1996A price-channel case study with a pending triangle signal and a planned stop-loss
- 1996Expanding triangle as a dual-label fourth-wave reversal worksheet
- 1997Rising wedge construction, breakout, and volume
- 1997Confirm structure and conditions before naming a Triangle pattern
- 1999Drawing the Triangle pattern before Breakout confirmation and the Stop-loss order
- 2000Four-phase market cycle triangle breakouts
- 2000Continuation triangles as a three-lock experiment
- 2001Folding rule: stacking three trendlines on an accelerating swing
- 2003A scored symmetrical triangle on a utility stock
- 2003Constructing wedges versus flat-boundary triangles
- 2004Testing triangle breakouts against volume filters
- 2004Mute triangles, histogram force, and trader optimization
- 2004Constructing falsifiable reversal and continuation patterns
- 2004Construct a corrective rising wedge before treating it as a short
- 2004A continuation triangle with Fibonacci targets and an apex stop
- 2005Pre-breakout filters for classic chart patterns
- 2005Reverse trendlines as a geometry lab for convergence and expanding triangles
- 2005Volume shapes versus triangle and double-pattern breakouts
- 2005A nested-pattern checklist on the 2005 euro
- 2005Volume test for a descending triangle breakout
- 2010Constructing triangle, broadening, and head and shoulders patterns
- 2011Treat a numeric pattern rank as a shortlist
- 2011Evaluating the head-and-shoulders as a falsifiable reversal
- 2013Auditing chart patterns by the first post-breakout swing
- 2014A three-gate entry for a triangle pullback
- 2014Golden triangle: a 50-day pause that still needs both gates
- 2014The triangle qualifier came after the rating pre-screen and the fifty-day bounce
- 2018Aligning daily, weekly, and monthly triangles with trendlines and Fibonacci retracements