1997issue C091-7
Confirm structure and conditions before naming a Triangle pattern
A two-step screen isolates a dominant price formation first, then uses Average Directional Index and related checks to judge trend-readiness and directional bias. Significant formations are defined by cyclic periodicity and natural trendlines, not by a textbook outline.
- A two-step screen isolates a dominant price formation first, then uses indicators to judge trend-readiness and directional bias rather than matching textbook shapes.
- Significant formations are defined by distinct cyclic periodicity and natural trendlines, and periodicity is treated as a more stable cue than amplitude.
- The most reliable formations tend to show at least two prominent consecutive time cycles of similar length, and horizontal congestions show the clearest periodicity.
- After structure is confirmed, an Average Directional Index reading below 15 cues breakout anticipation, while an early close through a boundary can be treated as a false break if trend-readiness is still absent.
Screen the formation first
A two-step screen first isolates a dominant price formation, then uses indicators to judge trend-readiness and directional bias rather than matching textbook shapes.
Significant formations are defined by well-defined structure: distinct cyclic periodicity plus natural trendlines, not by whether the outline looks like a named pattern.
Periodicity is the stable cue
The most reliable formations tend to show at least two prominent consecutive time cycles of similar length, visible as swing highs or lows separated by about the same number of bars.
Periodicity is treated as a more stable identification cue than cycle amplitude because amplitude varies more from cycle to cycle.
Horizontal congestions such as trading ranges, head-and-shoulders patterns, and symmetrical triangles show the least trend distortion of the cycle component and therefore the clearest periodicity.
Checks come after structure
Average Directional Index, moving averages, and basic cycle concepts are used as surgical checks on the state of a formation after the chart has already been screened for structure.
Trend-readiness and false breaks
An Average Directional Index reading below 15 is used as the cue to start anticipating a breakout; a close through the opposite boundary then defines the directional hypothesis.
An early close through a triangle boundary is treated as a false break when Average Directional Index has not yet signaled trend-readiness and price remains on the correct side of a rising 50-period simple moving average.
December 1992 coffee daily triangle and September break
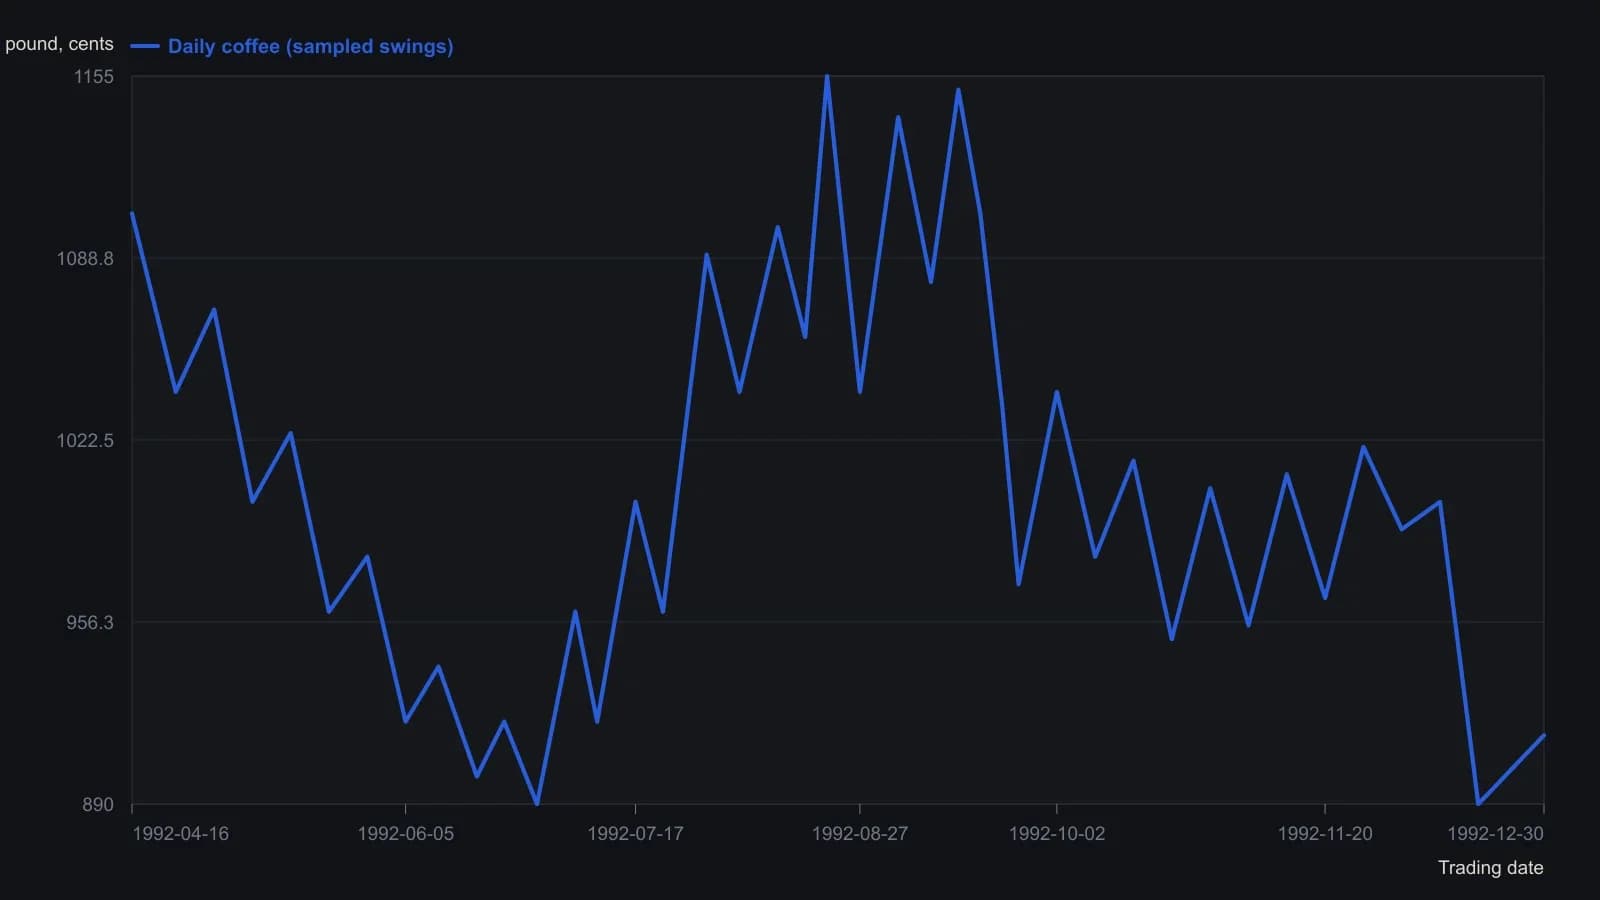
Swing highs and lows were read from the daily candlesticks and rounded to the nearest five cents; the 30 December close of 915 cents is the quote printed on the chart header. The ADX subplot is not mixed onto this price scale.
All readings on this track · 33 readings
- 1986Gold as a double zigzag before a contracting B-wave triangle
- 1990Scoring competing wave counts after a crash
- 1992Pre-trade checklist for trendline and triangle signals
- 1995Chart patterns as tactics, not strategy
- 1996Constructing Elliott wave counts with triangles and Fibonacci
- 1996A price-channel case study with a pending triangle signal and a planned stop-loss
- 1996Expanding triangle as a dual-label fourth-wave reversal worksheet
- 1997Rising wedge construction, breakout, and volume
- 1997Confirm structure and conditions before naming a Triangle pattern
- 1999Drawing the Triangle pattern before Breakout confirmation and the Stop-loss order
- 2000Four-phase market cycle triangle breakouts
- 2000Continuation triangles as a three-lock experiment
- 2001Folding rule: stacking three trendlines on an accelerating swing
- 2003A scored symmetrical triangle on a utility stock
- 2003Constructing wedges versus flat-boundary triangles
- 2004Testing triangle breakouts against volume filters
- 2004Mute triangles, histogram force, and trader optimization
- 2004Constructing falsifiable reversal and continuation patterns
- 2004Construct a corrective rising wedge before treating it as a short
- 2004A continuation triangle with Fibonacci targets and an apex stop
- 2005Pre-breakout filters for classic chart patterns
- 2005Reverse trendlines as a geometry lab for convergence and expanding triangles
- 2005Volume shapes versus triangle and double-pattern breakouts
- 2005A nested-pattern checklist on the 2005 euro
- 2005Volume test for a descending triangle breakout
- 2010Constructing triangle, broadening, and head and shoulders patterns
- 2011Treat a numeric pattern rank as a shortlist
- 2011Evaluating the head-and-shoulders as a falsifiable reversal
- 2013Auditing chart patterns by the first post-breakout swing
- 2014A three-gate entry for a triangle pullback
- 2014Golden triangle: a 50-day pause that still needs both gates
- 2014The triangle qualifier came after the rating pre-screen and the fifty-day bounce
- 2018Aligning daily, weekly, and monthly triangles with trendlines and Fibonacci retracements