2004issue C111-4
Construct a corrective rising wedge before treating it as a short
A rising wedge is two converging trendlines of unequal slope. The construction first classifies the advance as corrective or impulsive, then uses a Fibonacci retracement peak band and momentum divergence around any later breakdown.
- A rising wedge is two converging trendlines of unequal slope, with the lower line rising more steeply than the upper, so successive higher highs do not keep pace with successive higher lows.
- Classify the same converging advance as impulsive when it forms inside a larger uptrend making new highs, and as corrective when it is a smaller rally against a larger downtrend that stays below the high that started that decline.
- Confirmation is two price steps: a break of the rising lower trendline, then a print below the key prior reaction low, because the rising lower line still implies an upward bias until it gives way.
- After confirmation, the formation low is the minimum downside objective, and a measured move that subtracts the first decline from the wedge peak is the second objective.
What a rising wedge is
A rising wedge is constructed with two converging trendlines of unequal slope. The lower line rises more steeply than the upper, so successive higher highs do not keep pace with successive higher lows.
That structure is a converging two-trendline price pattern built from higher highs and higher lows whose unequal slopes close toward a point. The same shape can describe either a corrective rising wedge or an impulsive rising wedge.
Classify the advance first
The same converging advance is classified as impulsive when it forms inside a larger uptrend that is making new highs, and as corrective when it is a smaller rally against a larger downtrend.
An impulsive rising wedge is a rising, converging advance that forms in harmony with a larger uptrend, especially one that is already making new highs. A corrective rising wedge is a rising, converging advance that retraces only part of a larger decline and remains below the high that started that decline.
A corrective rising wedge is built to peak below the high that started the prior decline. A move through that prior peak would reclassify the advance as impulsive.
Locate the typical peak
The typical peak zone is a Fibonacci retracement of 38 percent to 62 percent of the prior decline. That 38 to 62 percent peak band, taken from the 38.2 and 61.8 ratios, is used to locate a typical end for a corrective advance against a prior decline.
The band is used as an alert rather than a hard cap. More volatile instruments are described as more likely to reach or overshoot the 62 percent end while still remaining below the prior peak.
Read volume as conviction, not as a requirement
Low volume during the wedge is preferred but not required and is treated as weak conviction in the advance. Volume expansion on a break of the lower trendline is presented as consistent with that reading.
Confirm in two price steps
Confirmation is constructed in two price steps: a break of the rising lower trendline, and then a print below the key prior reaction low. The rising lower line still implies an upward bias until it gives way.
Use divergence to anticipate the turn
A bearish price-indicator divergence, such as a new price high against a lower MACD high, can anticipate the turn. That split between a new price high inside the wedge and a lower high on a momentum measure such as MACD is used to anticipate that the advance is losing force.
A signal-line crossover or a move into negative territory can then confirm the trendline break or the lower low.
Project after confirmation, and mark failure
After confirmation, the formation low is treated as the minimum downside objective. A second objective is a measured move that subtracts the first decline from the wedge peak, switching to percentages when an absolute subtraction would imply a price below zero.
The construction is treated as failed if price reclaims the broken trendline or prior low and then breaks above nearby resistance.
The same construction, confirmation, and projection steps can be applied on intraday, daily, weekly, and monthly charts.
Merck weekly: rising wedge into 63.45, then the confirmation break
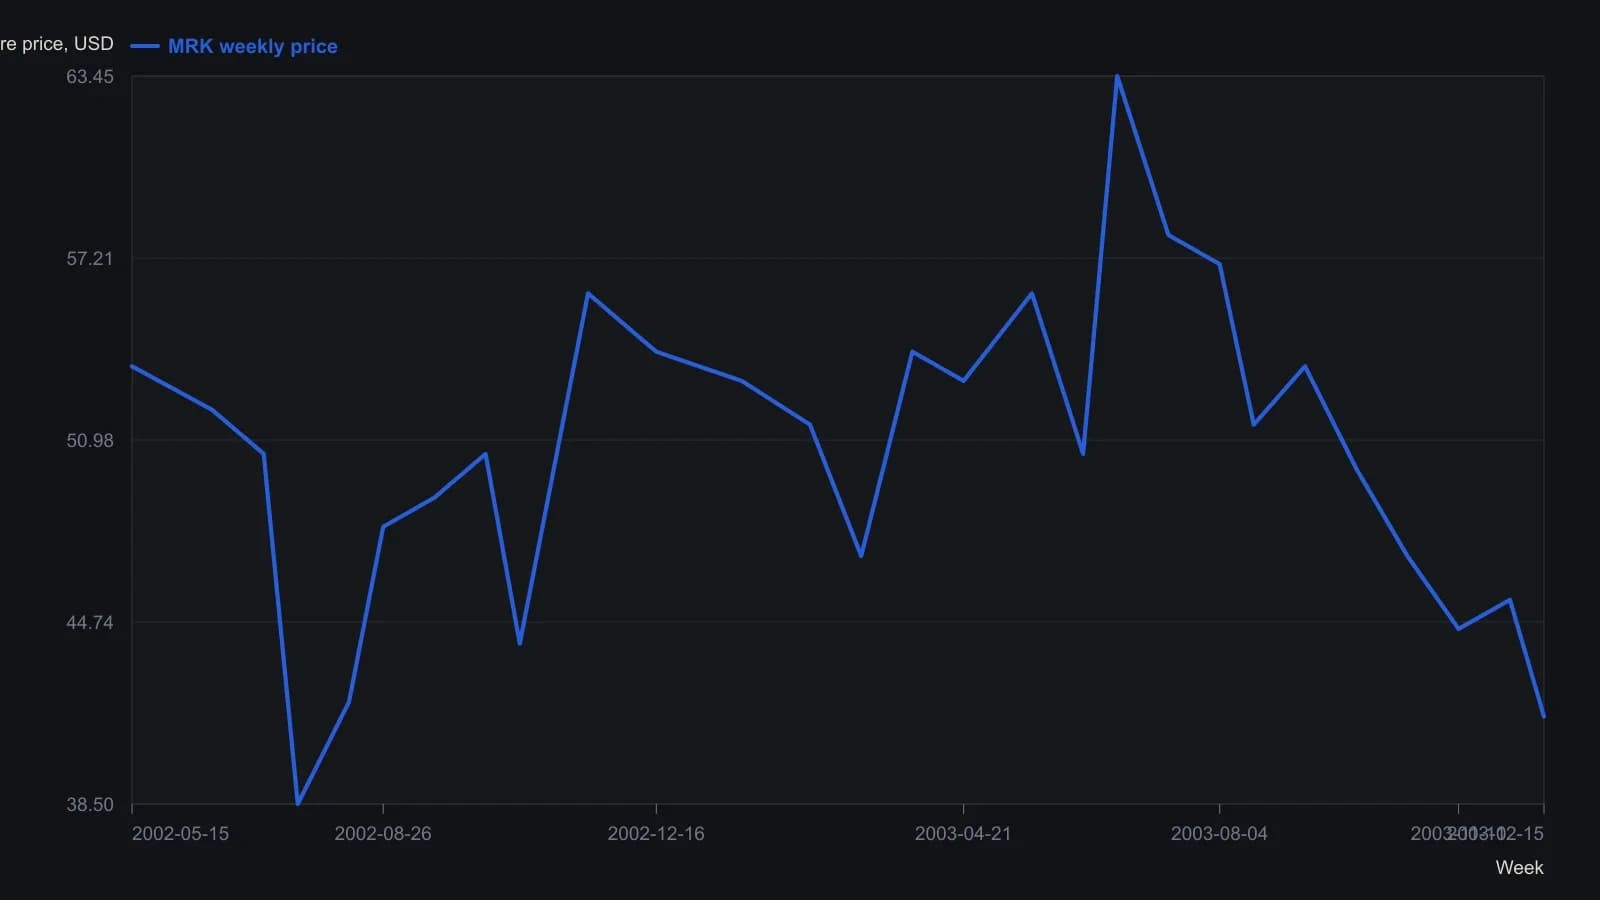
Hill’s MACD(12,26,9) pane is not redrawn on this price axis. He records a lower MACD high of 1.686 against the 63.45 price high, an earlier MACD high of 1.706, and a final MACD of −2.85 as the breakdown moved into negative territory.
All readings on this track · 33 readings
- 1986Gold as a double zigzag before a contracting B-wave triangle
- 1990Scoring competing wave counts after a crash
- 1992Pre-trade checklist for trendline and triangle signals
- 1995Chart patterns as tactics, not strategy
- 1996Constructing Elliott wave counts with triangles and Fibonacci
- 1996A price-channel case study with a pending triangle signal and a planned stop-loss
- 1996Expanding triangle as a dual-label fourth-wave reversal worksheet
- 1997Rising wedge construction, breakout, and volume
- 1997Confirm structure and conditions before naming a Triangle pattern
- 1999Drawing the Triangle pattern before Breakout confirmation and the Stop-loss order
- 2000Four-phase market cycle triangle breakouts
- 2000Continuation triangles as a three-lock experiment
- 2001Folding rule: stacking three trendlines on an accelerating swing
- 2003A scored symmetrical triangle on a utility stock
- 2003Constructing wedges versus flat-boundary triangles
- 2004Testing triangle breakouts against volume filters
- 2004Mute triangles, histogram force, and trader optimization
- 2004Constructing falsifiable reversal and continuation patterns
- 2004Construct a corrective rising wedge before treating it as a short
- 2004A continuation triangle with Fibonacci targets and an apex stop
- 2005Pre-breakout filters for classic chart patterns
- 2005Reverse trendlines as a geometry lab for convergence and expanding triangles
- 2005Volume shapes versus triangle and double-pattern breakouts
- 2005A nested-pattern checklist on the 2005 euro
- 2005Volume test for a descending triangle breakout
- 2010Constructing triangle, broadening, and head and shoulders patterns
- 2011Treat a numeric pattern rank as a shortlist
- 2011Evaluating the head-and-shoulders as a falsifiable reversal
- 2013Auditing chart patterns by the first post-breakout swing
- 2014A three-gate entry for a triangle pullback
- 2014Golden triangle: a 50-day pause that still needs both gates
- 2014The triangle qualifier came after the rating pre-screen and the fifty-day bounce
- 2018Aligning daily, weekly, and monthly triangles with trendlines and Fibonacci retracements