2004issue C061-3
Testing triangle breakouts against volume filters
When a triangle leaves its coil, volume-price analysis can ask two separate questions. One asks whether the breakout bar is unusually active for that same market. The other asks whether volume was rising or fading while the pattern was still forming. This archive article keeps those checks from being treated as a single confirmation.
- Compare breakout volume with that same market's own recent average. A quiet name's busy day can still be smaller than a liquid name's typical hour, so raw cross-stock volume comparisons are unusable.
- Treat a breakout as above-average only when volume exceeds twice the prior three-month average. Volume at or below that average is light.
- Ask a second, separate question about lifetime volume trend: whether a straight line fitted from the first day of the pattern to the last day slopes up or down.
- The historical tables describe group averages. Heavy breakout volume was the more frequent preferred label, especially on upward breaks, but some triangle and double-bottom rows preferred light volume, and individual examples both matched and contradicted the labels.
Two volume measurements, not one label
This historical workflow studied how an ascending, descending, or symmetrical triangle leaves a tightening coil bounded by converging trendlines. The teaching object is that leave, not the coil itself. The event under review is the breakout: the first decisive move through a pattern boundary.
Volume-price analysis then made a within-market comparison of recent typical volume with the volume that appears on the break, and with the slope of volume while the pattern was still forming. The two readings were used to judge whether participation supports the event, and they were not collapsed into a single volume score.
Judge breakout volume inside one market
Breakout volume was judged against each stock's own recent average. A quiet name's busy day can still be smaller than a liquid name's typical hour, which makes raw cross-stock volume comparisons unusable. The comparison stays inside one market: that name's recent typical volume versus the volume that appears on the break.
What counted as above-average
A breakout was classed as above-average only when volume exceeded twice the prior three-month average. Volume at or below that average was classed as light. That rule is a within-market filter, not a ranking against other names.
Preferred labels were not universal
The pattern-by-direction table assigned a preferred breakout-volume label to each row. Heavy was the more frequent label, especially among upward breaks. A minority of rows, including some triangle and double-bottom variants, were labeled as preferring light breakout volume, so heavy volume was not treated as a universal rule.
Light-volume results in the table sat close together, and the write-up flagged the chance that small samples were creating an unstable difference rather than a durable rule.
Average post-breakout move after heavy versus light volume
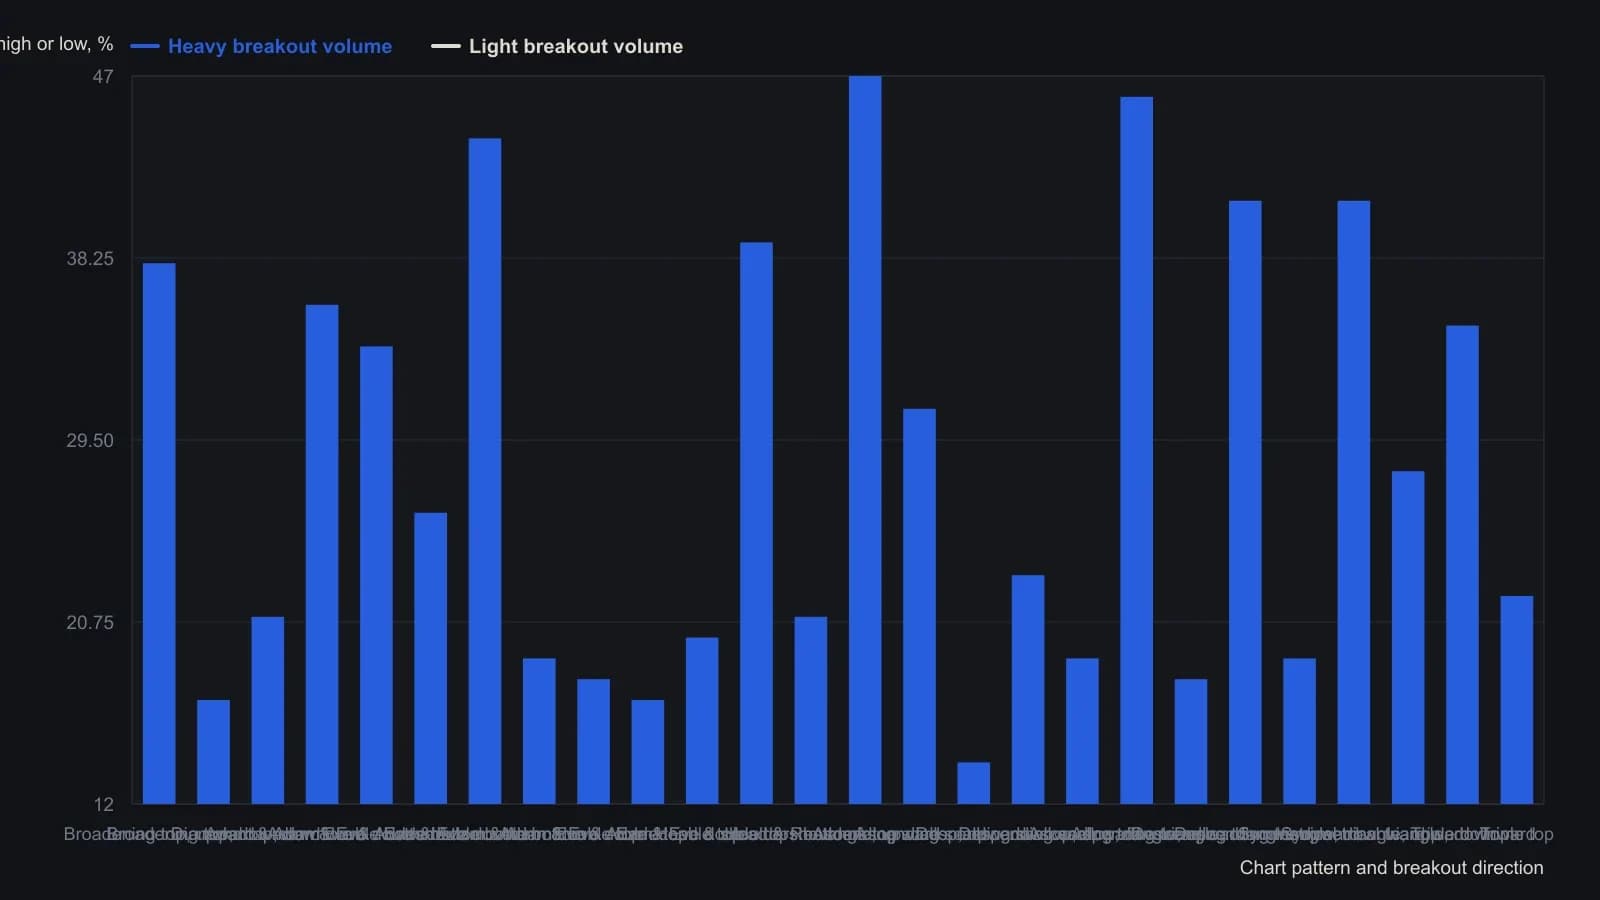
He scored a break as heavy only when volume was more than twice that same stock’s average for the three months before the break; light means average or lower. Cross-stock volume comparisons were avoided on purpose. Several light-volume averages sit within a point of each other, and he warned that some samples may be too small for a firm ranking.
Lifetime volume trend is a different measurement
Volume direction during the pattern was estimated by fitting a straight line to volume from the first day of the pattern to the last day, then labeling the slope as rising or falling. That lifetime volume trend is measured independently of the breakout bar.
The start-to-end volume-trend test did not produce one winner. The table split between combinations marked better with a rising slope and combinations marked better with a falling slope.
Tables describe group averages
Individual triangle and related-pattern examples were presented to show both matches and contradictions of the tabulated volume labels. The tables describe group averages rather than a guaranteed next outcome.
What the wrap-up treated as more consistent
The wrap-up treated breakout-day volume as the more consistent association and treated the forming-period volume trend as mixed for both upward and downward breaks. It also noted that a larger sample could change the reading.
All readings on this track · 33 readings
- 1986Gold as a double zigzag before a contracting B-wave triangle
- 1990Scoring competing wave counts after a crash
- 1992Pre-trade checklist for trendline and triangle signals
- 1995Chart patterns as tactics, not strategy
- 1996Constructing Elliott wave counts with triangles and Fibonacci
- 1996A price-channel case study with a pending triangle signal and a planned stop-loss
- 1996Expanding triangle as a dual-label fourth-wave reversal worksheet
- 1997Rising wedge construction, breakout, and volume
- 1997Confirm structure and conditions before naming a Triangle pattern
- 1999Drawing the Triangle pattern before Breakout confirmation and the Stop-loss order
- 2000Four-phase market cycle triangle breakouts
- 2000Continuation triangles as a three-lock experiment
- 2001Folding rule: stacking three trendlines on an accelerating swing
- 2003A scored symmetrical triangle on a utility stock
- 2003Constructing wedges versus flat-boundary triangles
- 2004Testing triangle breakouts against volume filters
- 2004Mute triangles, histogram force, and trader optimization
- 2004Constructing falsifiable reversal and continuation patterns
- 2004Construct a corrective rising wedge before treating it as a short
- 2004A continuation triangle with Fibonacci targets and an apex stop
- 2005Pre-breakout filters for classic chart patterns
- 2005Reverse trendlines as a geometry lab for convergence and expanding triangles
- 2005Volume shapes versus triangle and double-pattern breakouts
- 2005A nested-pattern checklist on the 2005 euro
- 2005Volume test for a descending triangle breakout
- 2010Constructing triangle, broadening, and head and shoulders patterns
- 2011Treat a numeric pattern rank as a shortlist
- 2011Evaluating the head-and-shoulders as a falsifiable reversal
- 2013Auditing chart patterns by the first post-breakout swing
- 2014A three-gate entry for a triangle pullback
- 2014Golden triangle: a 50-day pause that still needs both gates
- 2014The triangle qualifier came after the rating pre-screen and the fifty-day bounce
- 2018Aligning daily, weekly, and monthly triangles with trendlines and Fibonacci retracements