1989issue C111-4
Evaluating always-in parabolic SAR trailing stops
A trend-following design can stay continuously positioned by reversing when a trailing stop is hit. This article treats the acceleration schedule as an evaluation object: first the open profit the trail surrenders, then what changes when that same stop is also the reverse-entry trigger.
- The evaluated procedure is a trend-following design that stays continuously positioned by reversing when a trailing stop is hit.
- Two parameters govern the trail: an acceleration-factor increment and a maximum acceleration value that step successive reversal levels toward price.
- If the trend fails soon after entry, the stop may still be wide, so the reverse can arrive before tightening and the resulting loss can be large in a volatile market.
- Editorial: isolate surrendered open profit under the acceleration schedule first, then test the same trailing stop as a reverse-entry trigger.
What the procedure keeps in the market
The evaluated procedure is a trend-following design that stays continuously positioned by reversing when a trailing stop is hit. Trend-following here means a rule set that stays with directional continuation and remains positioned by reversing rather than standing aside.
The trailing stop is moved only in the trade's favor so remaining loss and open profit stay bounded as the position develops. When that stop is used as a reversal stop, it exits the current position and enters the opposite one, keeping the procedure continuously in the market.
The chart level itself is a parabolic SAR: a trailing reversal level that steps toward price after new favorable extremes and then holds at a maximum tightness.
What the acceleration schedule does to the trail
Two parameters govern the trail: an acceleration-factor increment and a maximum acceleration value. The acceleration factor is the fraction of the gap between the current stop and the trade extreme that is added to the stop on each update.
Each update adds the acceleration factor times the gap between the trade's most favorable price and the current stop, moving the next reversal level toward price. After a new favorable extreme, the acceleration factor steps higher until it reaches a cap.
Maximum acceleration is the upper bound on that fraction, after which further favorable extremes no longer increase tightness. The original published maximum is 0.20, after which the factor no longer increases.
Plotted against price, successive stops form a curve that starts relatively loose and tightens, up to that maximum, in the direction of the move.
When the first swing fails before the trail tightens
If the trend fails soon after entry, the stop may still be wide, so the reverse can arrive before tightening and the resulting loss can be large in a volatile market. That early-failure path is part of the same always-in rule, not a separate override.
Because a reversal stop is always present, the design is described as able to place the trader into any substantial, well-defined subsequent move. That description belongs to the archive workflow. It is not a claim about how often such a move appears or what it returns.
A historical sweep of the two parameters
A historical parameter sweep on perpetual contracts from January 1984 through December 1988 varied the increment from 0.01 to 0.03 and the maximum from 0.10 to 0.30, applied a 100-dollar slippage-and-commission charge, and added no second stop method because a reversal stop was already always in force.
Editorial: that sweep is a record of how the increment and the maximum were varied together under one always-in rule. This article does not treat it as a profitability finding.
Parabolic SAR net profit by market, 1984–1988
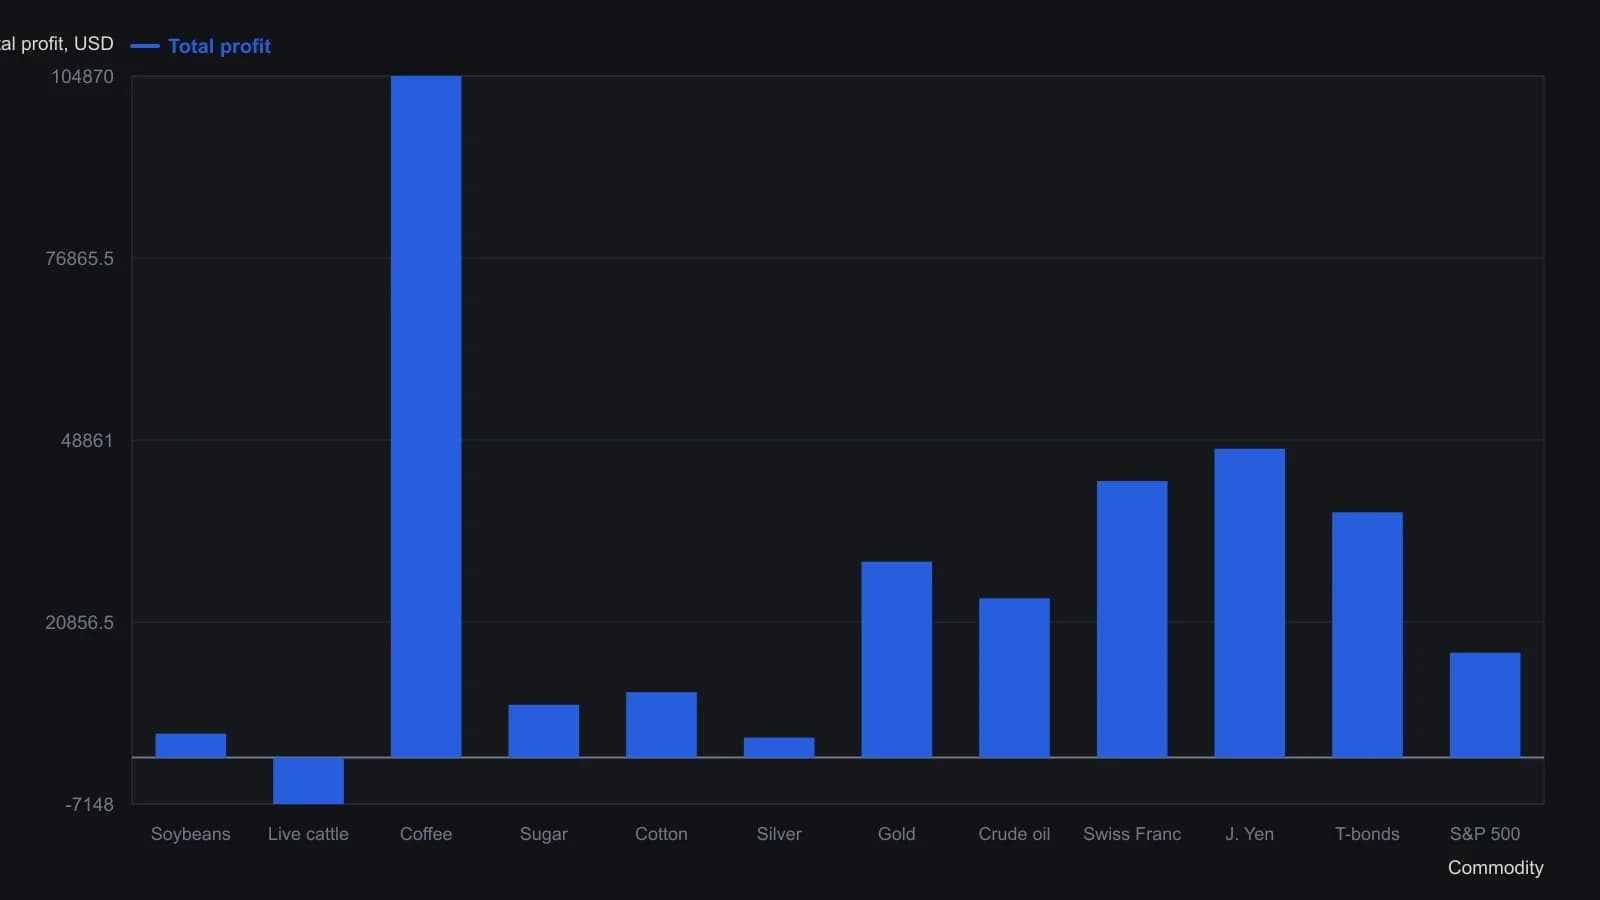
Each row uses the AF increment and maximum AF the author selected for that market after testing increments from 0.01 to 0.03 and caps from 0.10 to 0.30. Results are not a single common parameter set.
The same trail as an exit overlay
The same trailing-stop construction can serve as an exit overlay when another method supplies the entry and does not already trail a stop.
Editorial: the overlay case is the clean check on surrendered open profit, because the acceleration schedule then bounds the exit without also forcing the opposite entry.
All readings on this track · 21 readings
- 1987Constructing parabolic stops and cycle-window averages
- 1989Evaluating always-in parabolic SAR trailing stops
- 1993Constructing parabolic time-price trailing stops
- 1995Constructing parabolic SAR as an accelerating trail
- 1995Constructing a noise-buffered parabolic trailing stop
- 1997Constructing a parabolic trailing stop that only tightens
- 1998Triangle breakouts filtered by an exponential average and exited with parabolic stops
- 2000Treat volume-price imbalance as a hypothesis and let Parabolic SAR hold the exit
- 2002Constructing volatility stops from average true range and parabolic SAR
- 2002Parabolic SAR construction from stop outputs to reversal signals
- 2002Always-in-market SAR trail with directional confirmation
- 2004Forex trend confirmation with Average Directional Index, Parabolic SAR, and trendlines
- 2006Permission and fill gates for mechanical systems
- 2008A Relative Strength Index channel for profit lock and a trailing stop for capital protection
- 2010Building loss limits from the parabolic stop-and-reverse plot
- 2015Dual-zone currency indexes filter parabolic SAR signals
- 2016A parabolic trailing stop is not a complete system
- 2019Assigning jobs in a stochastic, parabolic, and moving-average stack
- 2019A three-filter stack as a redundancy test
- 2020Mechanical Parabolic SAR as an always-in flip after a breakout
- 2020Layering Relative Strength Index, MACD, and Parabolic SAR onto relative rotation maps