2000issue C021-7
Four-phase market cycle triangle breakouts
This archive lesson maps chart patterns onto accumulation, markup, distribution, and markdown. Editorially, the same triangle is treated as a continuation or a reversal only after a two-close 50-period simple moving average filter locates the phase and volume confirms the break.
- Locate the market in accumulation, markup, distribution, or markdown with a two-close 50-period simple moving average filter before classifying a triangle.
- Buying activity is associated with accumulation and markup, while selling activity is associated with distribution and markdown.
- A resistance, support, or neckline break is treated as a phase change only when volume expands at the break.
- After direction is set, triangle height is added to an upside break or subtracted from a downside break to form a measured objective.
A phase-dependent hypothesis
Editorially, TradersWeek treats every chart pattern in this material as a hypothesis that depends on market phase rather than as a standalone shape. The archive maps chart work onto four sequential phases: accumulation, markup, distribution, and markdown.
A two-period close above the 50-period simple moving average is treated as confirmation of an intermediate bullish bias. A two-period close below that average is treated as confirmation of an intermediate bearish bias.
How the four phases are located
Buying activity is associated with accumulation and markup. Selling activity is associated with distribution and markdown.
Markup and distribution are described as requiring price above the 50-period simple moving average. Markdown is described as requiring price below it. Accumulation is the buying-side base after a decline, typically a rectangular or coiled range that stays beneath a later markup until resistance breaks on expanding volume.
Accumulation into markup
In the accumulation-phase rectangular-base case, a range is treated as the usual setup window. A heavy-volume penetration of resistance is presented as the confirmation that the market has entered markup. Markup is the intermediate advance that begins once price holds above the 50-period simple moving average and a base or ascending triangle breaks higher with volume expansion.
Ascending triangle in markup
In the ascending-triangle markup case, resistance was tested repeatedly while pullbacks held above the 50-period moving average. The height of the triangle was added to the break area to form a measured objective. Volume expansion at the break was cited as confirmation.
ATHM ascending triangle break in the markup phase
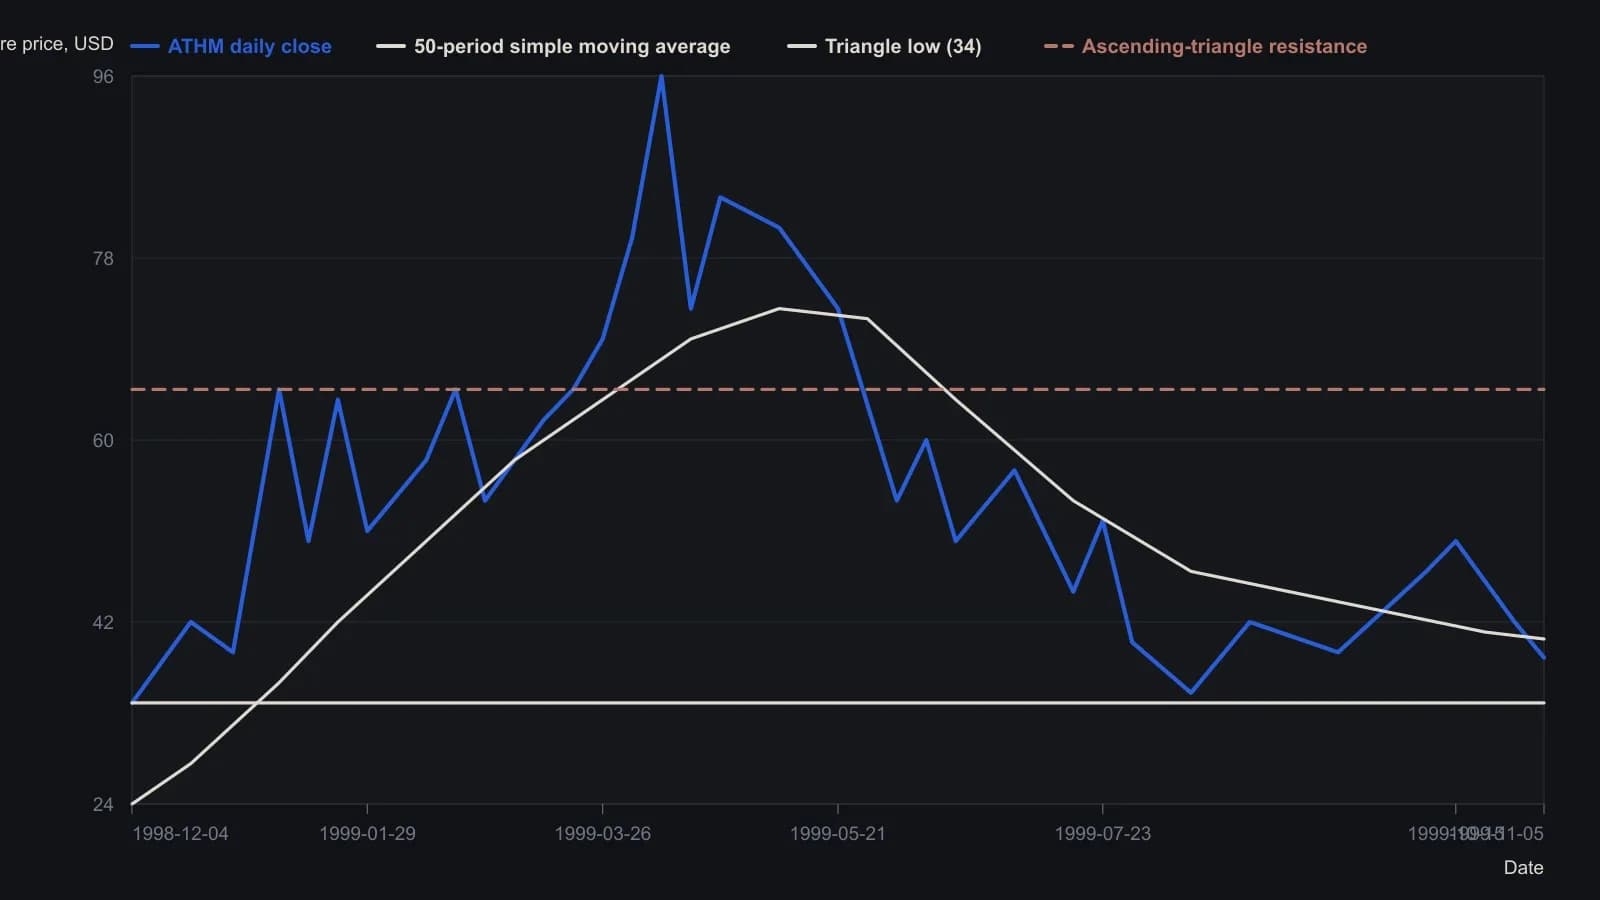
Closes and the 50-period simple moving average are weekly-ish samples from the daily raster, rounded to the nearest dollar except the printed final close 38.469 and average 40.321. Dukas confirms a phase only after two closes beyond the 50-period average; he counts five tests of 65 before the break.
Distribution into markdown
Distribution is the selling-side topping process that develops while price is still above the moving average, then fails that average and resolves through a neckline or resistance break. The distribution-phase head-and-shoulders example treats a first close through the 50-period moving average, a failed retest from below, and then a volume increase at the neckline break as confirmation. The measured objective is formed by subtracting the head-to-neckline height from the neckline.
Descending triangle in markdown
Markdown is the intermediate decline that is confirmed when price stays below the 50-period simple moving average and support, a descending triangle, or a coil breaks lower on expanding volume. The descending-triangle markdown example treats expanding volume at the support break as the confirmation that a major trend is ending. The measured objective is formed by subtracting the triangle height from the support line.
Reactions and coils
A double-top style reaction after an advance is described as typically retracing a substantial share of that advance over the following weeks. The second top prints considerably less volume than the first, and price finds support near the 50-period moving average.
In the markdown-phase symmetrical-triangle cases, a coil of lower highs and higher lows is treated as able to break either way. The prevailing phase and the moving-average side are used as the directional prior. Both illustrated breaks occurred on heavy volume after price had already lost the 50-period moving average. One example subtracts the coil height from the trendline break to form the measured objective.
Editorial reading
Editorially, the moving-average side is the directional prior, triangle height sets a falsifiable objective, and volume expansion is the confirmation that a phase change has occurred. The archive describes a historical workflow. It does not establish that the same sequence will repeat.
All readings on this track · 33 readings
- 1986Gold as a double zigzag before a contracting B-wave triangle
- 1990Scoring competing wave counts after a crash
- 1992Pre-trade checklist for trendline and triangle signals
- 1995Chart patterns as tactics, not strategy
- 1996Constructing Elliott wave counts with triangles and Fibonacci
- 1996A price-channel case study with a pending triangle signal and a planned stop-loss
- 1996Expanding triangle as a dual-label fourth-wave reversal worksheet
- 1997Rising wedge construction, breakout, and volume
- 1997Confirm structure and conditions before naming a Triangle pattern
- 1999Drawing the Triangle pattern before Breakout confirmation and the Stop-loss order
- 2000Four-phase market cycle triangle breakouts
- 2000Continuation triangles as a three-lock experiment
- 2001Folding rule: stacking three trendlines on an accelerating swing
- 2003A scored symmetrical triangle on a utility stock
- 2003Constructing wedges versus flat-boundary triangles
- 2004Testing triangle breakouts against volume filters
- 2004Mute triangles, histogram force, and trader optimization
- 2004Constructing falsifiable reversal and continuation patterns
- 2004Construct a corrective rising wedge before treating it as a short
- 2004A continuation triangle with Fibonacci targets and an apex stop
- 2005Pre-breakout filters for classic chart patterns
- 2005Reverse trendlines as a geometry lab for convergence and expanding triangles
- 2005Volume shapes versus triangle and double-pattern breakouts
- 2005A nested-pattern checklist on the 2005 euro
- 2005Volume test for a descending triangle breakout
- 2010Constructing triangle, broadening, and head and shoulders patterns
- 2011Treat a numeric pattern rank as a shortlist
- 2011Evaluating the head-and-shoulders as a falsifiable reversal
- 2013Auditing chart patterns by the first post-breakout swing
- 2014A three-gate entry for a triangle pullback
- 2014Golden triangle: a 50-day pause that still needs both gates
- 2014The triangle qualifier came after the rating pre-screen and the fifty-day bounce
- 2018Aligning daily, weekly, and monthly triangles with trendlines and Fibonacci retracements