2005issue C121
Volume test for a descending triangle breakout
Treat a finished descending triangle as a classroom hypothesis, not a completed signal. The flat base becomes a downside case only when the breakout bar’s range and volume agree, and a measured-move target stays on the whiteboard until that volume-price-test is passed.
- A descending-triangle close through the flat base is a downside hypothesis, not a completed signal.
- Breakout-conviction requires the breakout bar’s range and volume to agree. A wide-range break on low volume remains an unconfirmed probe.
- A measured-move target stays on the whiteboard until a volume-price-test shows that selling dominated the break.
- A completed triangle can still fail, so the setup is a case to watch rather than a settled outcome.
A classroom hypothesis, not a completed signal
A descending-triangle is a contraction with a flat lower boundary and a falling sequence of highs. A close through the base is the conventional downside trigger. TradersWeek editorial: that close does not finish the signal. The flat base becomes a downside case only when breakout-conviction is present, meaning the breakout bar’s range and volume agree.
This article treats the 2005 crude-oil episode as a finished pattern that still had to pass a volume-price-test. A measured-move target is left on the whiteboard until that test is passed.
The backdrop and the unfinished question
After an easing in crude-oil prices, the 40-day moving average had turned down and an upward-sloping trendline had broken. Prices remained below that average without yet reaching previously discussed lower levels.
A nearly completed descending triangle formed after a sharp decline and pullback. It was read as a downward bias. The remaining question was the strength of any downside breakout.
Light crude futures and the unfinished descending-triangle break
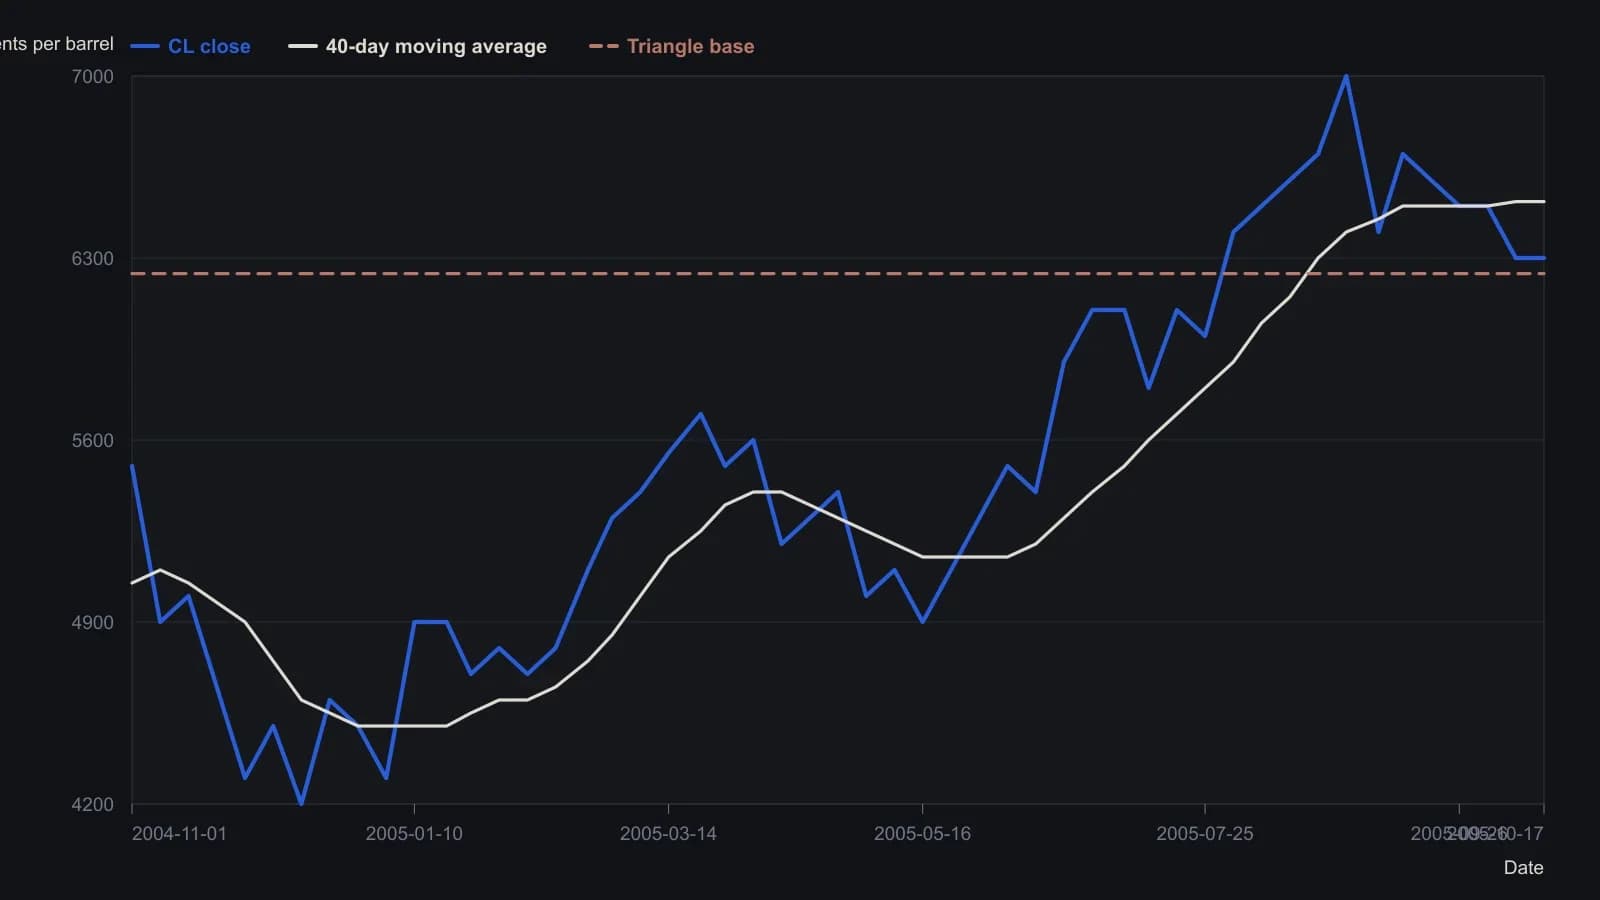
Weekly readings from the eSignal daily candlesticks, whose scale is cents per barrel. Allow about a 50-cent tolerance except for the printed 6240 triangle base and 6517 average. Volume bars were not digitized.
The volume-price-test on the break
Breakouts are typically associated with high volume, although downside breaks can also print on low volume. A volume-price-test compares the breakout bar’s volume with its price range to judge whether selling or buying dominated.
On October 6, 2005, prices broke below the triangle floor on a relatively wide-range session while volume was low. The next session had a smaller range but higher volume. That pair of bars was interpreted as selling that lacked follow-through and as more buying than selling interest.
TradersWeek editorial: the first session expanded range without volume agreement, so it is an unconfirmed probe rather than breakout-conviction. The volume-price-test was not passed on the breakout bar.
The measured move stays on the whiteboard
A downside breakout with conviction was described as typically producing a fast rather than gradual decline. A theoretical extension near 54.50 was based on the triangle’s high-to-low distance. That height-based map is a measured-move. It projects a theoretical destination by applying the triangle’s high-to-low span beyond the break.
TradersWeek editorial: the 54.50 map stays on the whiteboard until breakout-conviction is present. The destination is a classroom projection, not a working signal.
The case remains open
A completed triangle can still fail. The setup remains a case to watch rather than a settled outcome.
TradersWeek editorial: the descending-triangle supplied a falsifiable downside hypothesis. The volume-price-test left that hypothesis open.
All readings on this track · 33 readings
- 1986Gold as a double zigzag before a contracting B-wave triangle
- 1990Scoring competing wave counts after a crash
- 1992Pre-trade checklist for trendline and triangle signals
- 1995Chart patterns as tactics, not strategy
- 1996Constructing Elliott wave counts with triangles and Fibonacci
- 1996A price-channel case study with a pending triangle signal and a planned stop-loss
- 1996Expanding triangle as a dual-label fourth-wave reversal worksheet
- 1997Rising wedge construction, breakout, and volume
- 1997Confirm structure and conditions before naming a Triangle pattern
- 1999Drawing the Triangle pattern before Breakout confirmation and the Stop-loss order
- 2000Four-phase market cycle triangle breakouts
- 2000Continuation triangles as a three-lock experiment
- 2001Folding rule: stacking three trendlines on an accelerating swing
- 2003A scored symmetrical triangle on a utility stock
- 2003Constructing wedges versus flat-boundary triangles
- 2004Testing triangle breakouts against volume filters
- 2004Mute triangles, histogram force, and trader optimization
- 2004Constructing falsifiable reversal and continuation patterns
- 2004Construct a corrective rising wedge before treating it as a short
- 2004A continuation triangle with Fibonacci targets and an apex stop
- 2005Pre-breakout filters for classic chart patterns
- 2005Reverse trendlines as a geometry lab for convergence and expanding triangles
- 2005Volume shapes versus triangle and double-pattern breakouts
- 2005A nested-pattern checklist on the 2005 euro
- 2005Volume test for a descending triangle breakout
- 2010Constructing triangle, broadening, and head and shoulders patterns
- 2011Treat a numeric pattern rank as a shortlist
- 2011Evaluating the head-and-shoulders as a falsifiable reversal
- 2013Auditing chart patterns by the first post-breakout swing
- 2014A three-gate entry for a triangle pullback
- 2014Golden triangle: a 50-day pause that still needs both gates
- 2014The triangle qualifier came after the rating pre-screen and the fifty-day bounce
- 2018Aligning daily, weekly, and monthly triangles with trendlines and Fibonacci retracements