2018issue C1028-29
Aligning daily, weekly, and monthly triangles with trendlines and Fibonacci retracements
Daily, weekly, and monthly directional triangles can share one daily chart so higher-interval trend changes stay visible. Editorial reading: treat that layout as a multi-interval test bench in which parent triangles state the channel, a matching lower-interval triangle times the pullback, and trendlines plus Fibonacci retracements mark only where the continuation hypothesis would fail.
- Daily, weekly, and monthly directional triangles can be plotted together on one daily chart, so higher-interval trend changes are visible without opening a separate chart for each interval.
- Stock, forex, and mutual-fund sequences used monthly triangles for longer-term direction and weekly triangles for candidate entries. Futures sequences used weekly triangles for longer-term direction and daily triangles for shorter-term entries.
- Short-horizon stock setups on a daily chart were accepted only when they matched the longer-term triangle direction. Trendline and Fibonacci retracement tools in the same workspace were available to judge entries and exits around that read.
- Each triangle encoded direction, with date and price on inspection and a corner summary of monthly, weekly, and daily colors, prices, and an overall trend score. Symbols were also scored from +100 to -100 and scanned across 24 trend-level groups.
One daily chart as a multi-interval test bench
Daily, weekly, and monthly directional triangles can be plotted together on one daily chart so higher-interval trend changes are visible without opening a separate chart for each interval.
Editorial reading: treat that daily chart as a multi-interval test bench. Stacked monthly and weekly triangles state the parent channel. A matching lower-interval triangle times the pullback. Trendlines and Fibonacci retracements mark only where that continuation hypothesis would fail.
How triangle overlays recorded direction
A triangle overlay is a red or green directional mark on OHLC price that records a hypothesized trend change on a chosen interval. Each triangle encoded direction. Inspecting a mark showed the date and price of that event. A chart-corner summary listed the current monthly, weekly, and daily triangle colors, those prices, and an overall trend score.
Those triangle overlays could be added on most chart intervals from daily through quarterly, but they were not available on intraday charts.
Parent triangles and matching entries
The illustrated daily chart of Toronto-listed CNR carried monthly and weekly triangles while price appeared to be approaching a retest of the January 2018 highs. The illustrated short-horizon stock workflow combined weekly and daily triangles on a daily chart and accepted only setups that matched the longer-term triangle direction.
A higher-interval triangle is the monthly or weekly directional mark treated as the parent trend. Lower-interval setups are not allowed to contradict it. The documented stock, forex, and mutual-fund sequence used monthly triangles for the longer-term direction and weekly triangles for candidate entries. The documented futures sequence used weekly triangles for the longer-term direction and daily triangles for shorter-term entries.
Trendlines and Fibonacci retracements as failure marks
The same charting workspace included trendline and Fibonacci retracement tools, plus candlestick, bar, or line display, for judging entries and exits around the triangle read.
A trendline is a drawn line on swing highs or lows used to test whether price is still traveling inside the channel implied by the triangle read. A Fibonacci retracement is a measured pullback grid on a prior swing, used to locate where a triangle-aligned continuation would be invalidated.
Editorial reading: keep those two tools as failure marks, not as a second directional call. If price leaves the channel implied by the triangle read, or if a pullback exceeds the Fibonacci retracement used as the invalidation grid, the continuation hypothesis is treated as failed.
Trend-strength scores and scan groups
Symbols were scored from +100 to -100 for trend strength and direction and could be scanned across 24 trend-level groups to surface early trends or pullbacks inside an existing trend. The trend-strength score is a signed ranking that grades how one-sided recent price movement has been.
MarketClub Smart Scan groups by listed symbol count
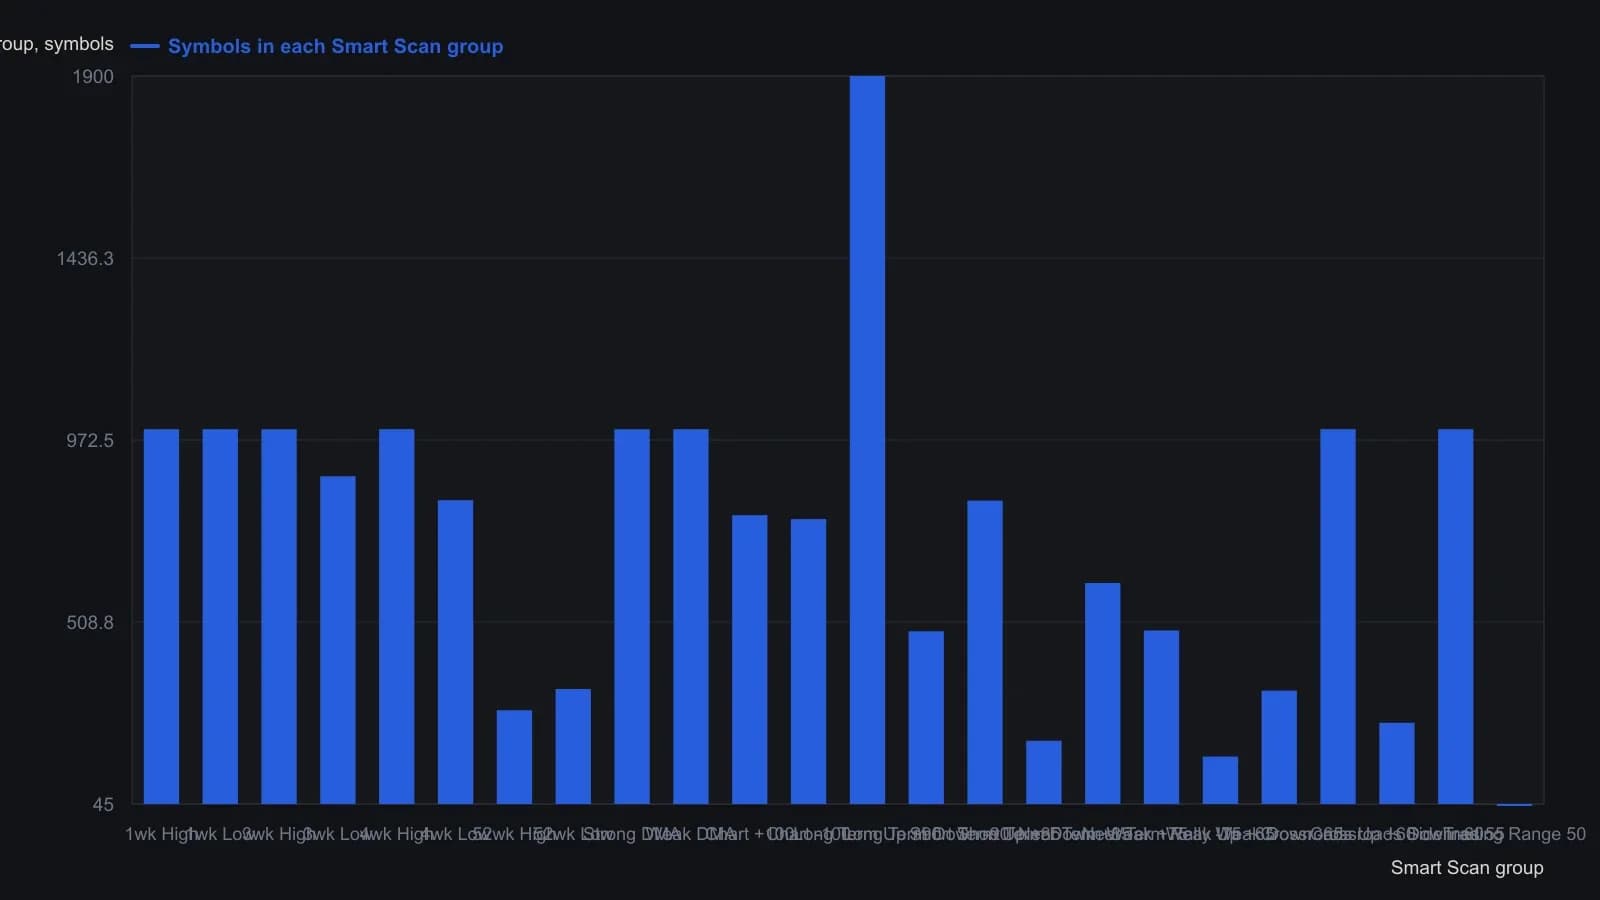
The page highlights Long Term Up +90 and then applies Equity, price above $20, and volume above 500,000, which is why only nine charts are listed even though that bucket shows 1900 names. Several chips read exactly 1000, which may be a display cap rather than the full database count. Short Term Down is labeled +85 on the source chip, matching the printed text.
All readings on this track · 33 readings
- 1986Gold as a double zigzag before a contracting B-wave triangle
- 1990Scoring competing wave counts after a crash
- 1992Pre-trade checklist for trendline and triangle signals
- 1995Chart patterns as tactics, not strategy
- 1996Constructing Elliott wave counts with triangles and Fibonacci
- 1996A price-channel case study with a pending triangle signal and a planned stop-loss
- 1996Expanding triangle as a dual-label fourth-wave reversal worksheet
- 1997Rising wedge construction, breakout, and volume
- 1997Confirm structure and conditions before naming a Triangle pattern
- 1999Drawing the Triangle pattern before Breakout confirmation and the Stop-loss order
- 2000Four-phase market cycle triangle breakouts
- 2000Continuation triangles as a three-lock experiment
- 2001Folding rule: stacking three trendlines on an accelerating swing
- 2003A scored symmetrical triangle on a utility stock
- 2003Constructing wedges versus flat-boundary triangles
- 2004Testing triangle breakouts against volume filters
- 2004Mute triangles, histogram force, and trader optimization
- 2004Constructing falsifiable reversal and continuation patterns
- 2004Construct a corrective rising wedge before treating it as a short
- 2004A continuation triangle with Fibonacci targets and an apex stop
- 2005Pre-breakout filters for classic chart patterns
- 2005Reverse trendlines as a geometry lab for convergence and expanding triangles
- 2005Volume shapes versus triangle and double-pattern breakouts
- 2005A nested-pattern checklist on the 2005 euro
- 2005Volume test for a descending triangle breakout
- 2010Constructing triangle, broadening, and head and shoulders patterns
- 2011Treat a numeric pattern rank as a shortlist
- 2011Evaluating the head-and-shoulders as a falsifiable reversal
- 2013Auditing chart patterns by the first post-breakout swing
- 2014A three-gate entry for a triangle pullback
- 2014Golden triangle: a 50-day pause that still needs both gates
- 2014The triangle qualifier came after the rating pre-screen and the fifty-day bounce
- 2018Aligning daily, weekly, and monthly triangles with trendlines and Fibonacci retracements