2014issue C0924-27
Golden triangle: a 50-day pause that still needs both gates
After a fast advance, a pullback to the 50-day simple moving average is only a working hypothesis. The archive workflow waits for a close back above that line and for volume to confirm. A tidy triangle with heavy volume at the low is the reminder that shape alone is not confirmation.
- A golden triangle is a post-advance pause whose left leg pulls back into the 50-day simple moving average, not an unstructured dip.
- Price confirmation is a close back above that average after a touch or undercut, and the name is abandoned if that close does not appear within three weeks.
- Volume confirmation requires an up close, or the special same-session reclaim, with volume above the 50-day volume average and stronger than recent sessions.
- Heavy volume near the low, even when price later recovers past the pivot, is treated as a reason the triangle shape is not confirmation.
How the setup is specified
The golden triangle is specified as a pause after a fast advance in which the pullback is judged against a 50-day simple moving average rather than as an unstructured dip. A qualifying prior rise is defined as price advancing faster than its 50-day simple moving average, with wider empty space between the price bars and that average treated as stronger momentum.
The pivot is the intraday high that ends the prior rise. The left side of the triangle is a two-day to four-week pullback that reaches or slightly undercuts the 50-day simple moving average. In this workflow the 50-day simple average of price is both the pullback destination and the reclaim line, and a 50-day simple average of volume is the activity baseline.
Volume on the pullback
On a pullback of a week or longer, an overall decline in volume is treated as fading selling pressure, while expanding volume on the way down is treated as a reason to skip the name. On a two- or three-day pullback, high volume is expected on the down days.
Price and volume gates
Price confirmation is a close back above the 50-day simple moving average after a touch or undercut. If that close does not appear within three weeks, the name is abandoned.
Volume confirmation is an up close, or a same-session undercut that then closes back above the 50-day simple moving average, whose volume is above its 50-day average and stronger than recent days. That same-session reclaim is the only down-close day allowed as a signal.
If volume does not confirm on the price-confirmation day, later up closes are watched until volume is both above average and stronger than the prior day. A later close back below the 50-day simple moving average cancels price confirmation until another close above the average, after which volume must confirm again.
The stated buy range
The stated buy window runs from the lowest confirmation point in the triangle to 5 percent above the pivot. The pivot later caps the upper end of that buy range.
Two daily-chart cases from 2013
In the 2013 FleetCor daily-chart case, the April 10 high of 78.87 marked the pivot. Pullback volume from that high to the April 19 average test was below average except for one slightly above-average day. On April 19, price undercut the 50-day simple moving average and closed back above it with volume above that volume average and the highest in two weeks.
In the 2013 Portfolio Recovery Associates daily-chart case, price made a nine-day drop from the September 26 high of 61.60 to a close back above the 50-day simple moving average and then recovered past the pivot in seven sessions. The heaviest volume days sat near the low, and the reversal day did not confirm volume.
Editorial interpretation: TradersWeek reads the pair as a fail-first classroom. FleetCor printed both gates, including a same-session reclaim with above-average volume. Portfolio Recovery Associates shows that a tidy triangle and a later recovery past the pivot still fail when volume-price analysis does not confirm.
FleetCor daily close: 88% run then a 50-day SMA pause
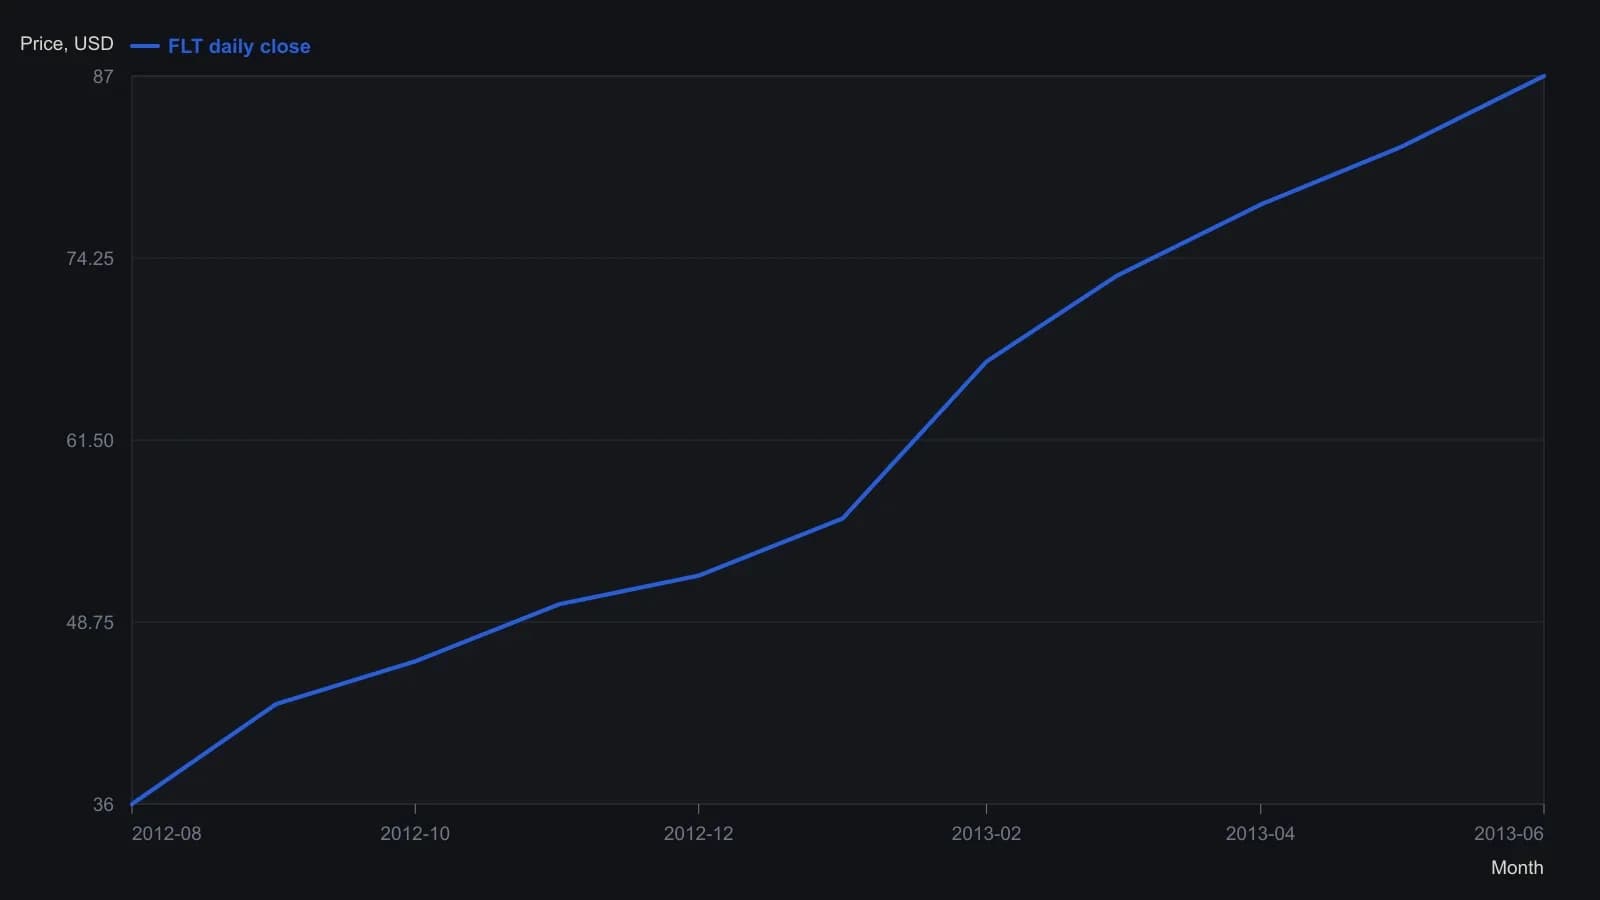
Closes digitized from the BigCharts FLT daily raster (Aug 2012–Jun 19, 2013). Approximate to about 0.5–1 point; volume pane and SMA not plotted. April 10 pivot 78.87 and later 61% gain to 118.73 are stated in the text, not taken from this panel.
All readings on this track · 33 readings
- 1986Gold as a double zigzag before a contracting B-wave triangle
- 1990Scoring competing wave counts after a crash
- 1992Pre-trade checklist for trendline and triangle signals
- 1995Chart patterns as tactics, not strategy
- 1996Constructing Elliott wave counts with triangles and Fibonacci
- 1996A price-channel case study with a pending triangle signal and a planned stop-loss
- 1996Expanding triangle as a dual-label fourth-wave reversal worksheet
- 1997Rising wedge construction, breakout, and volume
- 1997Confirm structure and conditions before naming a Triangle pattern
- 1999Drawing the Triangle pattern before Breakout confirmation and the Stop-loss order
- 2000Four-phase market cycle triangle breakouts
- 2000Continuation triangles as a three-lock experiment
- 2001Folding rule: stacking three trendlines on an accelerating swing
- 2003A scored symmetrical triangle on a utility stock
- 2003Constructing wedges versus flat-boundary triangles
- 2004Testing triangle breakouts against volume filters
- 2004Mute triangles, histogram force, and trader optimization
- 2004Constructing falsifiable reversal and continuation patterns
- 2004Construct a corrective rising wedge before treating it as a short
- 2004A continuation triangle with Fibonacci targets and an apex stop
- 2005Pre-breakout filters for classic chart patterns
- 2005Reverse trendlines as a geometry lab for convergence and expanding triangles
- 2005Volume shapes versus triangle and double-pattern breakouts
- 2005A nested-pattern checklist on the 2005 euro
- 2005Volume test for a descending triangle breakout
- 2010Constructing triangle, broadening, and head and shoulders patterns
- 2011Treat a numeric pattern rank as a shortlist
- 2011Evaluating the head-and-shoulders as a falsifiable reversal
- 2013Auditing chart patterns by the first post-breakout swing
- 2014A three-gate entry for a triangle pullback
- 2014Golden triangle: a 50-day pause that still needs both gates
- 2014The triangle qualifier came after the rating pre-screen and the fifty-day bounce
- 2018Aligning daily, weekly, and monthly triangles with trendlines and Fibonacci retracements