2004issue C061-4
Mute triangles, histogram force, and trader optimization
A symmetrical triangle stays a two-path procedure until a second reading, such as histogram peak-versus-trough force, assigns a provisional bias that can still be overturned. Editorial view: treat the operator as the system under optimization, and treat a second tool as confirmation or non-confirmation rather than a search for one best indicator.
- Pair a familiar oscillator or pattern with a second independent tool as a confirmation or non-confirmation step, not as a search for one best indicator.
- A symmetrical triangle supplies few post-breakout directional clues, so both measurement-rule paths stay on the worksheet until surrounding context assigns a provisional bias.
- Peak-trough comparison judges buyer versus seller force by whether a histogram high is larger in magnitude than a later histogram low, rather than by matching the histogram to price.
- A deep histogram trough that implies selling pressure is not an automatic sell signal when an opposing oscillator divergence sits beside bearish pattern and histogram context.
The operator is the procedure
A familiar oscillator or pattern can still miss market behavior that a second independent tool would flag. Pairing tools is presented as a confirmation or non-confirmation step rather than a search for a single best indicator.
Editorial view: that pairing is trader optimization. The operator is the system under optimization, including when a deep histogram trough is context rather than an automatic exit.
A failed higher high as a stall warning
After a high, a pullback, and a higher high, the absence of upside follow-through is treated as a stall warning. That failed higher high raises the chance that the prior advance has stalled. The later correction size still depends on other technical conditions.
A mute triangle keeps both paths open
A symmetrical triangle is a contracting range between converging trendlines. By itself it supplies little post-breakout direction and is described as giving few directional clues after the breakout. Surrounding context is what supplies the provisional bias.
A two-day break of an intermediate moving average can become the back of a later symmetrical triangle as price fills between that plunge's high and low.
Histogram force without matching price
The MACD histogram is the plotted difference between the two moving averages that form a moving-average convergence-divergence reading. Comparing histogram extremes to each other, rather than matching the histogram to price, is offered as a way to judge whether the last advance or the last decline carried more force. That peak-trough comparison asks whether a histogram high is larger in magnitude than a later histogram low.
A relatively high histogram peak followed by a shallow trough below zero is read as buyers still in control. The corresponding dip toward a moving average, trendline, or channel is framed as a test of that reading.
Deep histogram troughs indicate the shorter average is declining faster than the longer average, which is said to make subsequent rallies harder when other bearish factors are also present.
Paired objectives before direction is known
The same triangle width can be added to and subtracted from the apex to produce paired minimum objectives. That measurement rule keeps both breakout paths on the worksheet before direction is known.
Divergence leaves a probability problem
Deep histogram troughs that imply selling pressure are explicitly not automatic sell signals. An opposing oscillator divergence can sit beside bearish pattern and histogram context, leaving the outcome a probability problem for the operator.
Editorial view: a symmetrical triangle stays a two-path procedure until a second reading, such as histogram peak-versus-trough force, assigns a provisional bias that can still be overturned.
EUR/USD daily with 50-day EMA and triangle objectives
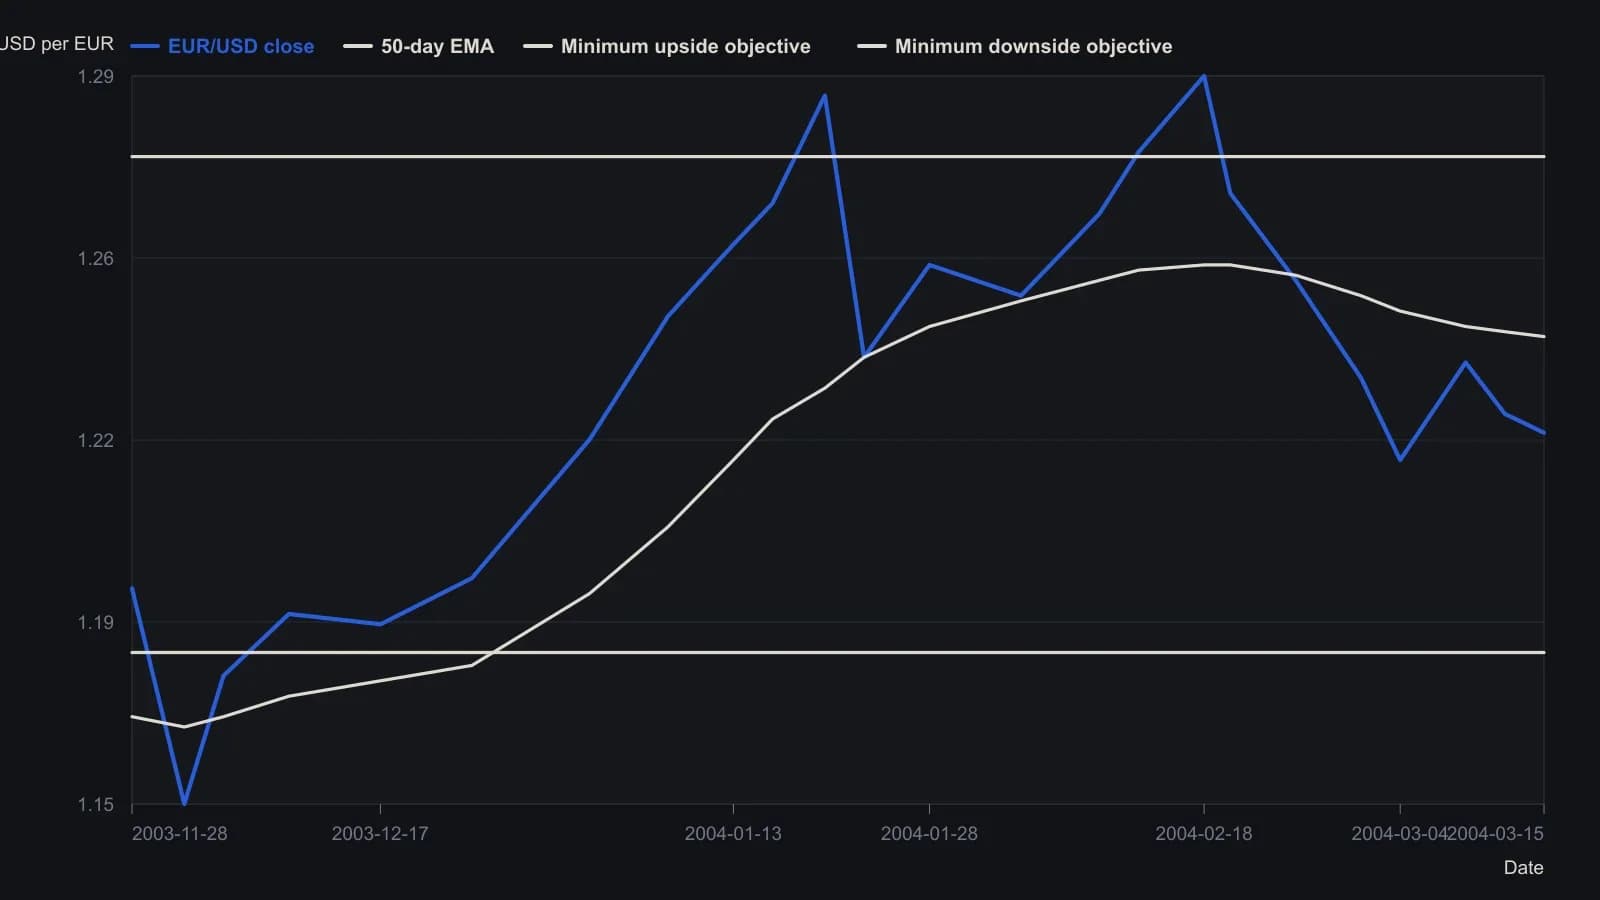
Closes and the moving average are digitized from the raster and are only good to roughly 20–40 pips. Last print 1.2233 and average 1.24205 are the on-screen quotes. The 1.2928 February high and the 1.2771 / 1.1805 measured objectives are the article’s stated figures, not pixel measurements.
All readings on this track · 33 readings
- 1986Gold as a double zigzag before a contracting B-wave triangle
- 1990Scoring competing wave counts after a crash
- 1992Pre-trade checklist for trendline and triangle signals
- 1995Chart patterns as tactics, not strategy
- 1996Constructing Elliott wave counts with triangles and Fibonacci
- 1996A price-channel case study with a pending triangle signal and a planned stop-loss
- 1996Expanding triangle as a dual-label fourth-wave reversal worksheet
- 1997Rising wedge construction, breakout, and volume
- 1997Confirm structure and conditions before naming a Triangle pattern
- 1999Drawing the Triangle pattern before Breakout confirmation and the Stop-loss order
- 2000Four-phase market cycle triangle breakouts
- 2000Continuation triangles as a three-lock experiment
- 2001Folding rule: stacking three trendlines on an accelerating swing
- 2003A scored symmetrical triangle on a utility stock
- 2003Constructing wedges versus flat-boundary triangles
- 2004Testing triangle breakouts against volume filters
- 2004Mute triangles, histogram force, and trader optimization
- 2004Constructing falsifiable reversal and continuation patterns
- 2004Construct a corrective rising wedge before treating it as a short
- 2004A continuation triangle with Fibonacci targets and an apex stop
- 2005Pre-breakout filters for classic chart patterns
- 2005Reverse trendlines as a geometry lab for convergence and expanding triangles
- 2005Volume shapes versus triangle and double-pattern breakouts
- 2005A nested-pattern checklist on the 2005 euro
- 2005Volume test for a descending triangle breakout
- 2010Constructing triangle, broadening, and head and shoulders patterns
- 2011Treat a numeric pattern rank as a shortlist
- 2011Evaluating the head-and-shoulders as a falsifiable reversal
- 2013Auditing chart patterns by the first post-breakout swing
- 2014A three-gate entry for a triangle pullback
- 2014Golden triangle: a 50-day pause that still needs both gates
- 2014The triangle qualifier came after the rating pre-screen and the fifty-day bounce
- 2018Aligning daily, weekly, and monthly triangles with trendlines and Fibonacci retracements