1996issue C121-4
Expanding triangle as a dual-label fourth-wave reversal worksheet
Both classical chart-pattern study and Elliott wave analysis treat an expanding or broadening triangle as an uncommon candidate for reversing a long-term trend. This case maps the same five widening swings onto classical and Elliott labels, then locks the reversal idea to one named close or new-high test so the chart can be proven wrong.
- An expanding or broadening triangle is an uncommon widening coil of higher highs and lower lows, used as a long-horizon reversal hypothesis rather than an everyday contracting continuation pattern.
- The same five swings can carry classical labels 1 through 5 and Elliott labels a through e, with the coil placed in the fourth wave of a five-wave sequence before a final thrust.
- Treat a close through a named prior low, or a new high after a completed five-wave rise and retracement, as the test that confirms or rejects the reversal case.
- While the form is still unfolding, false breakouts are expected to whip trend-following approaches. After the pattern is judged in force, watch three sequential observational windows.
A reversal coil rather than the everyday triangle
Both classical chart-pattern study and Elliott wave analysis treat an expanding or broadening triangle as a candidate reversal of a long-term trend.
Contracting triangles in symmetrical, ascending, and descending forms are presented as the everyday forecasting set, while expanding triangles are described as uncommon.
In this usage, an expanding or broadening triangle is a widening coil of higher highs and lower lows used as a long-horizon reversal hypothesis rather than a contracting continuation coil.
Sketch five widening swings
The usual expanding-triangle sketch uses three peaks, each above the prior peak, and two troughs in which the second trough is below the first.
Activity through an expanding triangle is typically elevated, yet later buying is described as failing to extend price as far as earlier in the advance.
The same expanding structure can be read as a broadening top: late-cycle distribution, with declines still attracting buyers even as later advances travel less effectively.
Two label sets on one major top
The same widening structure can carry classical labels 1 through 5 and Elliott labels a through e at once, as two descriptions of one major top.
In the Elliott count used here, an expanding triangle may occupy the fourth wave of a five-wave sequence, after which a fifth wave is expected and a sharp reversal is then anticipated.
That fifth wave is not required to exceed the triangle's d high, though it often does. The five-wave impulse framework places the expanding triangle in the fourth-wave position before a final fifth-wave thrust and a larger trend change.
Lock the reversal to one named test
A breakout here is a close through a named prior low, or a new high after a completed five-wave rise and retracement, used to confirm or reject the reversal case.
In the archive's large-cap index example, a close below a named prior low would confirm at least an intermediate top, while a finished five-wave rise, a pullback, and a later new high would support a bullish alternative. The triangle could also widen through another down-up swing.
DJIA expanding triangle vs the July 5182 close test
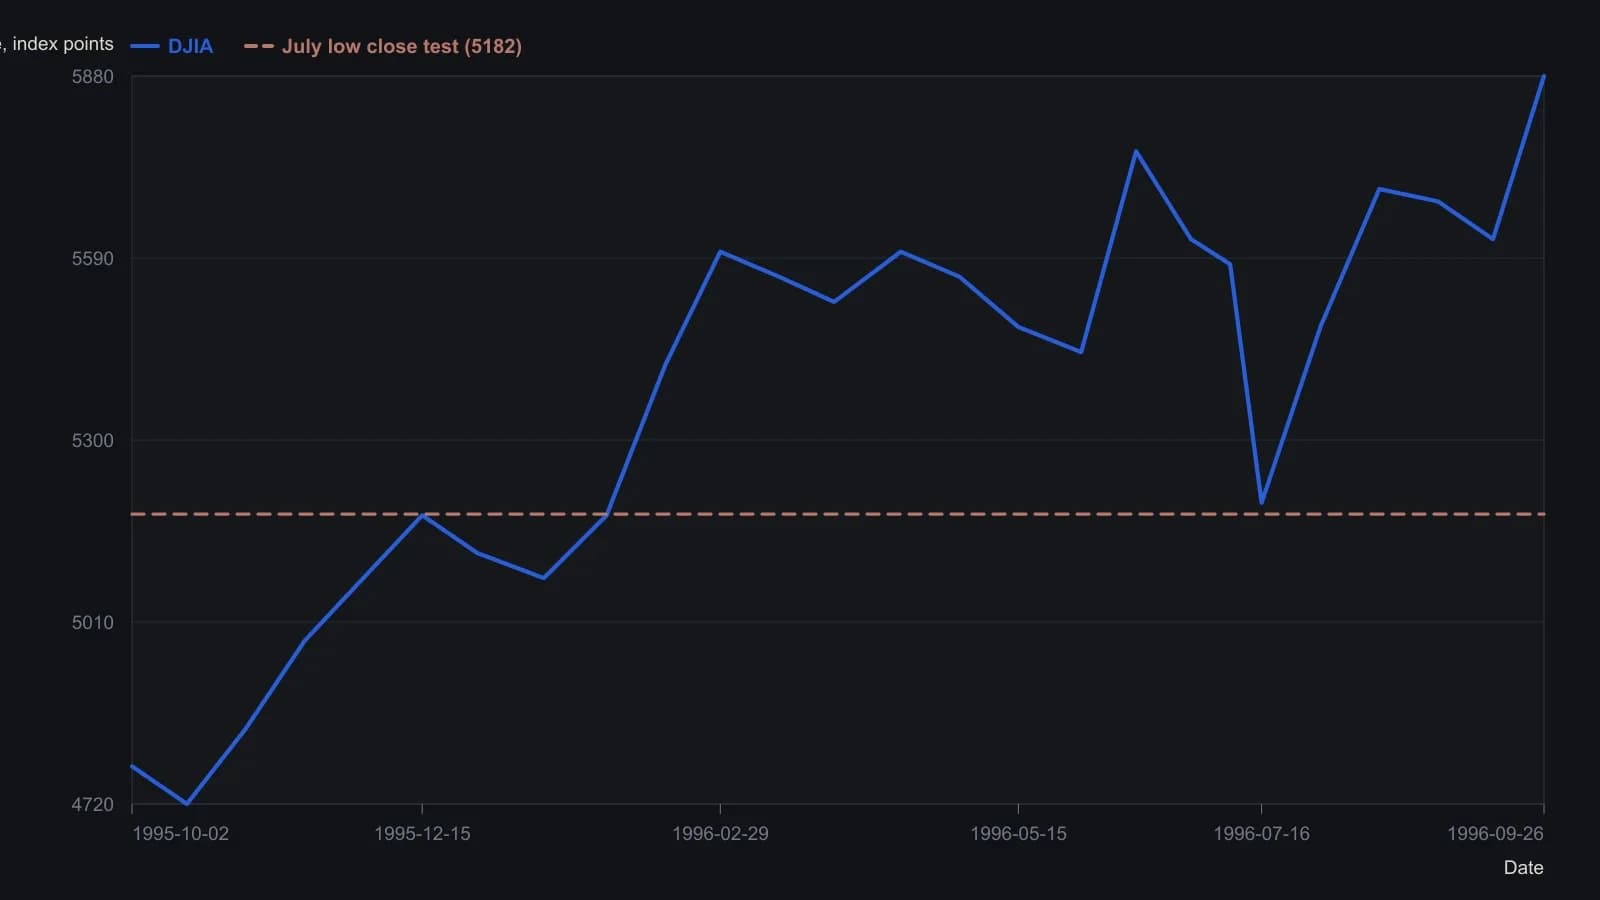
Price points are digitized from the OmniTrader candlestick pane (nearest 10 DJIA points). The 5182 July low is the figure Webster names in the text, not a line drawn on the screenshot. The pane does not print a numerical last close.
False breakouts while the form is still unfolding
While the expanding form is still unfolding, multiple false breakouts are expected to whip trend-following approaches. Shorter-horizon systems are described as less exposed to those reversals.
A false breakout is a thrust beyond a widening boundary that quickly reverses, producing the repeated failed signals associated with this pattern while it is still forming.
Three observational windows after the pattern is judged in force
After the pattern is judged to be in force, three sequential observational windows are listed: a rise from point 4 or Elliott wave e toward point 5 or wave V; a reversal attempt near point 5, with tighter exit logic once price returns toward point 3; and a later breakdown after a sharp rally back into the triangle.
Editorial note: read those three windows as a sequence of observations on one chart, not as a requirement that each stage will appear.
All readings on this track · 33 readings
- 1986Gold as a double zigzag before a contracting B-wave triangle
- 1990Scoring competing wave counts after a crash
- 1992Pre-trade checklist for trendline and triangle signals
- 1995Chart patterns as tactics, not strategy
- 1996Constructing Elliott wave counts with triangles and Fibonacci
- 1996A price-channel case study with a pending triangle signal and a planned stop-loss
- 1996Expanding triangle as a dual-label fourth-wave reversal worksheet
- 1997Rising wedge construction, breakout, and volume
- 1997Confirm structure and conditions before naming a Triangle pattern
- 1999Drawing the Triangle pattern before Breakout confirmation and the Stop-loss order
- 2000Four-phase market cycle triangle breakouts
- 2000Continuation triangles as a three-lock experiment
- 2001Folding rule: stacking three trendlines on an accelerating swing
- 2003A scored symmetrical triangle on a utility stock
- 2003Constructing wedges versus flat-boundary triangles
- 2004Testing triangle breakouts against volume filters
- 2004Mute triangles, histogram force, and trader optimization
- 2004Constructing falsifiable reversal and continuation patterns
- 2004Construct a corrective rising wedge before treating it as a short
- 2004A continuation triangle with Fibonacci targets and an apex stop
- 2005Pre-breakout filters for classic chart patterns
- 2005Reverse trendlines as a geometry lab for convergence and expanding triangles
- 2005Volume shapes versus triangle and double-pattern breakouts
- 2005A nested-pattern checklist on the 2005 euro
- 2005Volume test for a descending triangle breakout
- 2010Constructing triangle, broadening, and head and shoulders patterns
- 2011Treat a numeric pattern rank as a shortlist
- 2011Evaluating the head-and-shoulders as a falsifiable reversal
- 2013Auditing chart patterns by the first post-breakout swing
- 2014A three-gate entry for a triangle pullback
- 2014Golden triangle: a 50-day pause that still needs both gates
- 2014The triangle qualifier came after the rating pre-screen and the fifty-day bounce
- 2018Aligning daily, weekly, and monthly triangles with trendlines and Fibonacci retracements