2006issue C031-5
Constructing a trend system from Bollinger Bands and z-scores
The construction classifies a one-standard-deviation envelope and a z-score of one as the same reading of trend versus range, then writes the matching long and short rules as one mechanical procedure with the stop set at entry.
- Prices inside a one-standard-deviation band around a moving average are classified as range conditions, and prices outside that band are classified as trend conditions.
- A 20-period, one-standard-deviation envelope and a z-score threshold of one encode the same four rules and can be written as a fully specified mechanical procedure.
- System design begins with the mean and standard deviation of returns, and the trading plan requires a stop at the moment of entry.
- Close-to-close historical tests omit slippage, intraday false breaks, contract rolls, and immediate rather than closing fills.
Classify range and trend first
The construction first classifies prices inside a one-standard-deviation band around a moving average as range conditions and prices outside that band as trend conditions.
A z-score is the close minus an n-period moving average, divided by the n-period standard deviation, so the sign of the score locates price above or below the mean.
Two writings of the same four rules
The Bollinger Bands envelope is specified as a 20-period lookback and a one-standard-deviation width rather than the two-standard-deviation default, so a close above the upper band marks an uptrend and a close below the lower band marks a downtrend.
Z-score normalization locates the same close relative to the mean. Band comparisons and z-score thresholds encode the same four rules and can be written as a fully specified mechanical procedure that does not rely on discretionary override.
Entry, exit, and staying out
A long opens when the close is above the upper band or the z-score is greater than 1, and that long closes when the close or the z-score falls back through the same threshold.
A short opens when the close is below the lower band or the z-score is less than -1, and that short covers when the close or the z-score recrosses the lower threshold.
While the close remains inside the band, the construction classifies the series as a range condition. Trend following is then the four rules above, written as one mechanical procedure.
Measure the series before coding rules
System design begins with the mean and standard deviation of returns so the prevailing drift and volatility of the series are known before any entry or exit rule is coded.
The trading plan requires a stop at the moment of entry, illustrated as a fixed five-point offset from the fill, so the loss that is allowed is set before the position is live.
Restate the procedure, then judge the fills
The same band-and-z-score procedure was restated on other futures series after the lookback length and the number of standard deviations were allowed to change.
Close-to-close historical tests omit slippage, intraday false breaks, contract rolls, and immediate rather than closing fills, so the constructed procedure has to be judged under those execution differences.
Yearly net profit of the BBZ rules on KLSE CI futures
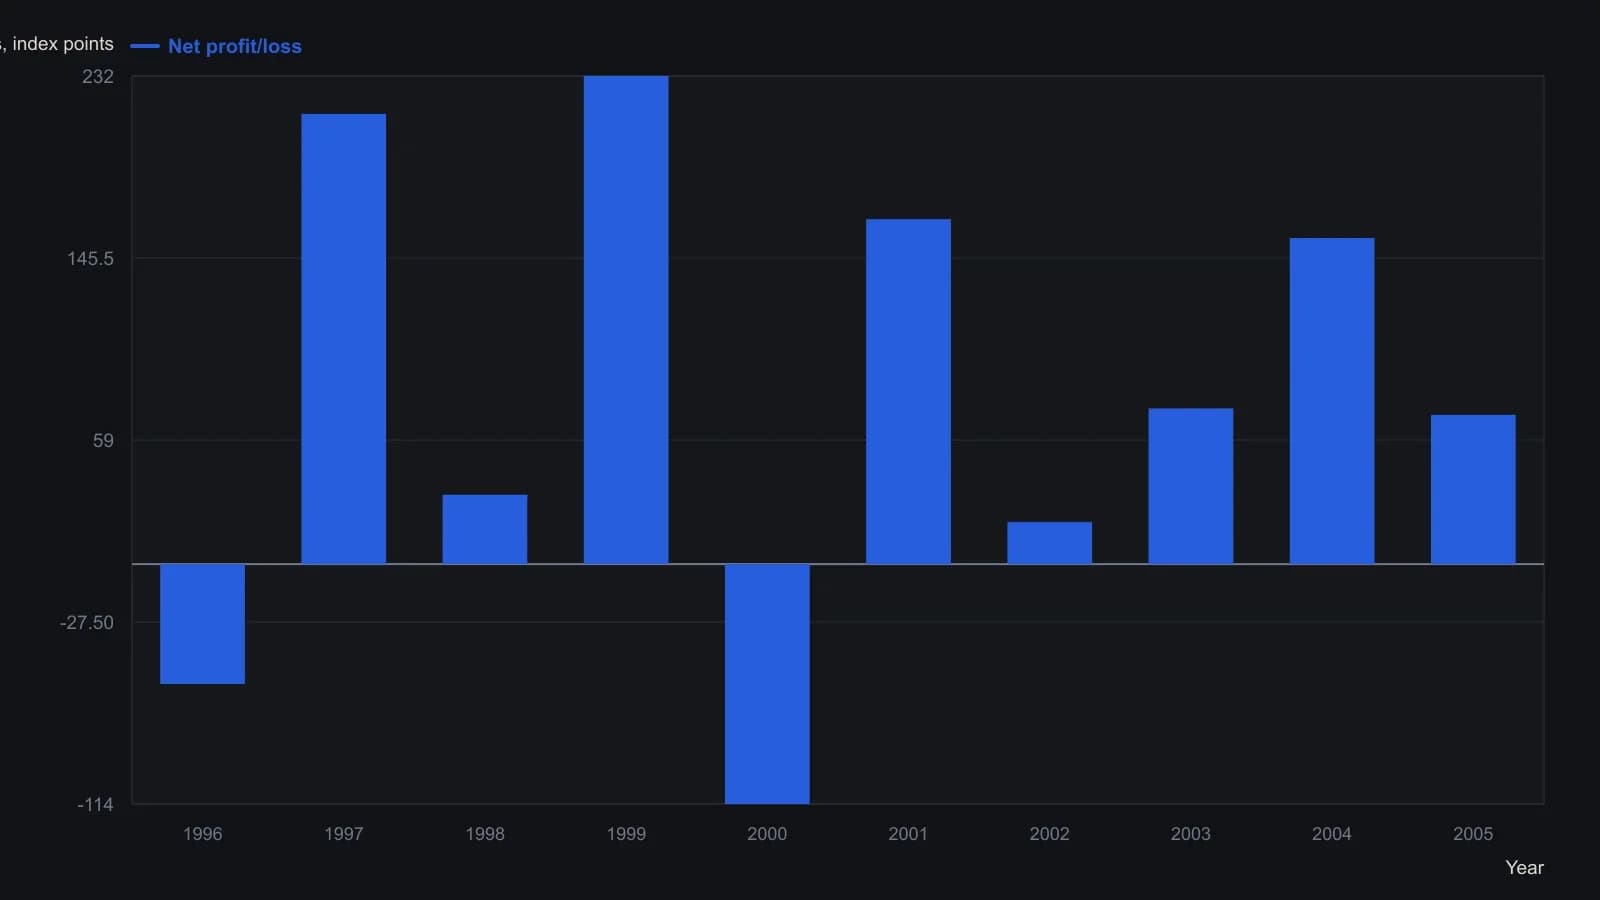
The test used a 20-day simple moving average and one standard deviation, with 0.6 index point charged on each entry and each exit. The 1997 window starts on 1 February; the 2005 window ends on 7 December.
All readings on this track · 11 readings
- 1991Constructing standardized sentiment trend filters
- 1995Market z-score residuals for style pair construction
- 1995Constructing scaled z-score normalization for model inputs
- 1996Normalize price and volume onto a common scale
- 2001Constructing pair spreads with z-score triggers
- 2003Rebuilding band distance as a z-score crossover
- 2003Constructing price z-scores with dual averages and bands
- 2003Zigzag target zones from a normalized deviation oscillator
- 2005Constructing a z-score scored range-breakout filter
- 2006Constructing a trend system from Bollinger Bands and z-scores
- 2011How an adjustable-bands z-test resizes the no-trade zone