1984issue C011-10
Gold swing chart: failed highs, wash-out, and a boxed pivot range
A staged swing-chart protocol on June and December gold futures locked a greater-trend on a failed high and a broken monthly-bottom, sat through the post-break wash-out, and left a later double bottom as only potential until a monthly high penetration would turn the boxed pivot-point range into a new two-sided hypothesis.
- A monthly swing-chart treated a failed second peak near a prior high as a double-top-bottom distribution area and named a monthly-bottom break as the confirmation of a greater-trend.
- After that confirmation, the protocol sat through wash-out risk around a long-held weekly support band instead of taking an automatic reverse entry.
- A later low near a prior-contract extreme stayed potential-versus-actual until a later month penetrated the prior month's high.
- Until that upgrade, 428.80 and 390 were the pivot-point extremes of a range; a break of either side was the next falsifiable signal while the greater-trend remained in force.
Three stages, one greater-trend
This archive article teaches a staged swing-chart protocol from one gold-futures episode. First lock the greater-trend on a failed high and a broken monthly-bottom. Next sit through the post-break wash-out. Then leave a later double bottom as only potential until a monthly high penetration turns the boxed pivot-point range into a new two-sided hypothesis.
A swing-chart is a scaled map of successive swing highs and lows, read from OHLC structure, used to state a greater-trend hypothesis that later prints can confirm or cancel. The later double-top-bottom and pivot-point marks are read against that map, not as a disorderly sequence of isolated prints.
Lock the greater-trend
A monthly swing-chart of a June gold futures contract treated failure to exceed a prior swing high near 527, after a second peak near 528, as a double-top-bottom distribution area and a sign of weakness.
That monthly swing reading set a break of the 413 swing low by 10 as the test that would emphatically confirm a greater bear trend. Here 413 is the monthly-bottom, a swing low whose break is read as a supply-demand shift, not merely a lower print. The greater-trend is the higher-horizon swing direction that remains in force until a named swing extreme is broken by a stated margin.
In the first week of June 1983 the June contract printed 396.20, 16.80 under 413, and the December contract printed 414, 19 under its 433 monthly swing bottom. Both prints were treated as confirmation of that greater bear trend.
Sit through the wash-out
On the weekly swing-chart, major bottoms in the 430s had held as support for 34 weeks. Once that band broke, the case study read a demand-to-supply shift and wash-out risk around 430. A wash-out is a one-sided liquidation burst that can follow a long-held support band giving way.
After greater-trend confirmation, an immediate reverse entry was not treated as automatic. A snap-back rally after the break was the later, defined-risk observation point.
Leave the later base as potential
From a 453 swing top, December gold declined about 80 over 13 weeks to 373, near a 370 prior-contract low from June 1982 that the monthly swing-chart marked as a potential double-top-bottom demand zone.
On the June 1984 monthly swing-chart a 392 low in the 390 support zone remained only a potential double bottom until a later month penetrated the prior month's high, stated as 428.80 from November if tested in December. That potential-versus-actual rule treats the chart condition as a hypothesis only, until a specified confirmation print upgrades it.
Box the pivot-point range
Until that upgrade, 428.80 and 390 were the upper and lower pivot-point marks of a range. A pivot-point is a defined range extreme whose breach is the next directional hypothesis, not a completed trend change by itself. A break of either side was the next falsifiable signal for a sizable rally or a reconfirmed decline, because the greater bear trend was still treated as in force.
Keep the range-background in view
Mapping price ranges across monthly and other horizons was presented as the range-background that keeps swing-chart, double-top-bottom, and pivot-point readings coherent instead of a disorderly sequence of isolated prints.
Editorial: the gold episode is a teaching sequence only when those marks stay inside that range-background. Failed high, monthly-bottom break, wash-out, potential double bottom, and boxed pivot-point extremes are not a completed trend change by themselves. The next two-sided hypothesis begins only if a later month penetrates the stated prior-month high, and only as a hypothesis while the named greater-trend rule can still cancel it.
December 1983 gold weekly swings versus the $430 monthly bottom
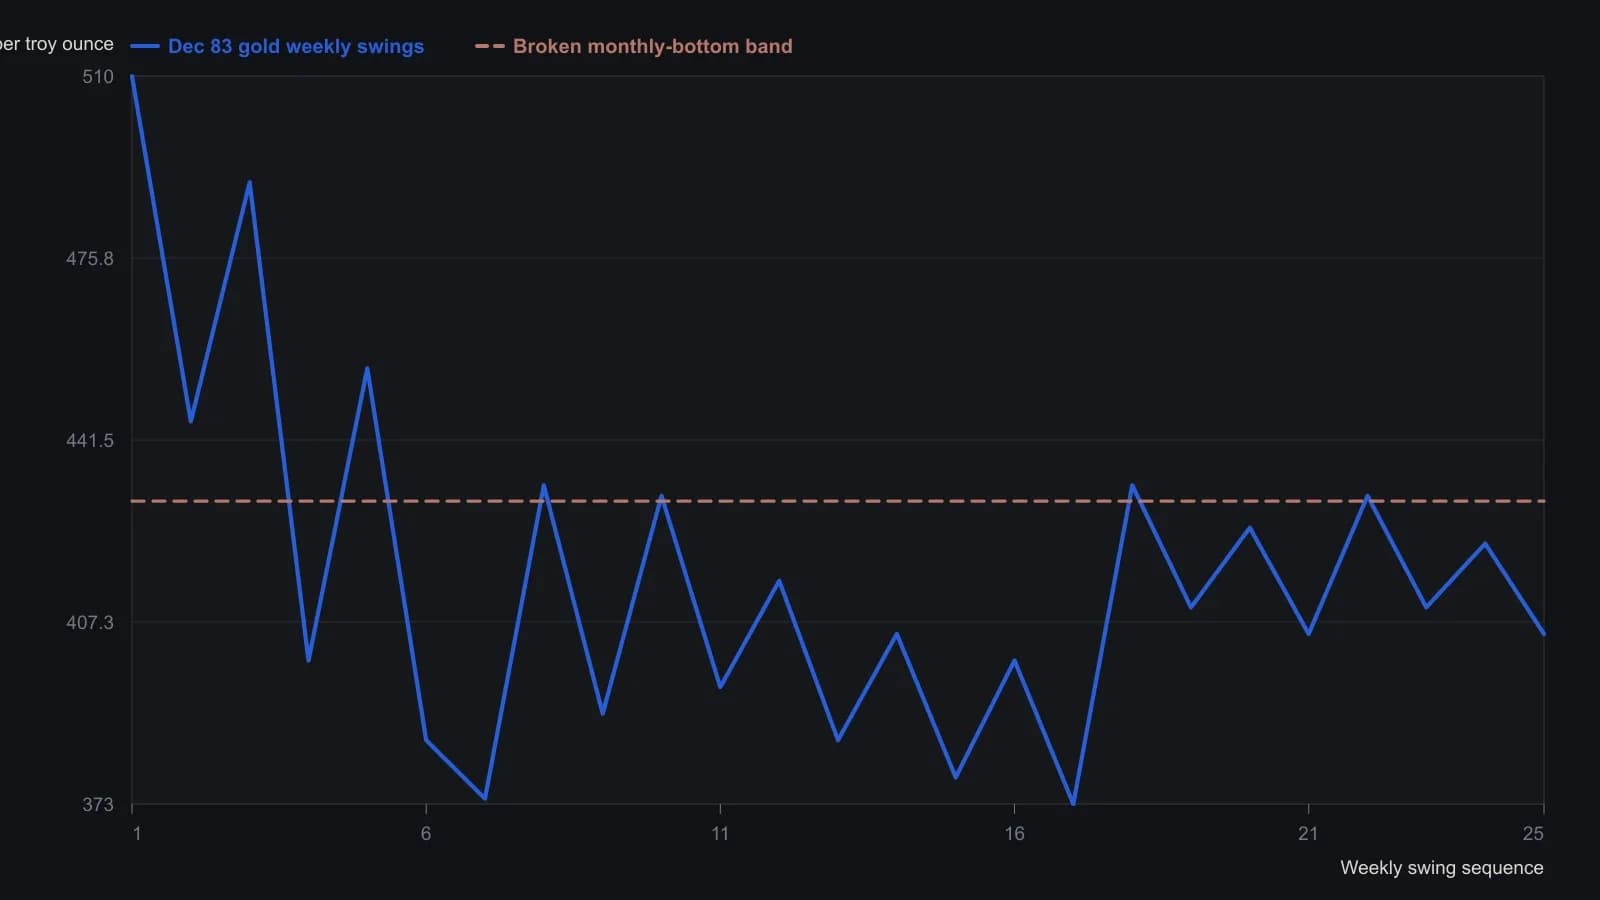
Source print is a hand-drawn weekly swing chart, not a table. Axis numerals are partly degraded; y-values follow the printed swing labels (510, 433, 431, 430, 374, 373) and nearby turns read off the same raster. No more precision is claimed than the scan can carry.
All readings on this track · 30 readings
- 1982Constructing range resistance from harmonic swing divisions
- 1984Gold swing chart: failed highs, wash-out, and a boxed pivot range
- 1988Remaining life on a percent-filtered swing chart
- 1991Ranking turning points with percentage swing filters
- 1991Five-count swing-chart construction and break rules
- 1992Constructing the Gann quarterly swing from the prior quarter's intraday range
- 1992Audit quarterly swing breakouts with a slower average cross
- 1992Weekly swing invalidation and the trailing stop
- 1992Quarterly swing chart construction and trend duration
- 1998A two-bar swing is unfinished until it names the stop
- 1999Multiple time-frame swing-channel trade setups
- 1999Separate two-bar swing direction from peak-valley trend
- 2000Constructing peak-trough swing reversals
- 2002Swing charts as shared grammar for trading mentorship
- 2002Confirming the last leg of a zigzag trend filter
- 2004When a late trend bends: test the pause before sizing a reversal
- 2006Crude oil swing counts and cycle clusters
- 2006When late rallies flatten: a swing-chart classroom
- 2006Relocating trading certainty to the decision process
- 2008Swing highs, bar-count pace, and the cost-price stop
- 2010Constructing suspect versus confirmed swing trends
- 2010Constructing swing charts from clear bar ranges
- 2010Building price force maps from two-bar swings
- 2010Clear-method swing-chart construction
- 2011Treat a squared-chart swing forecast as a same-day hypothesis
- 2012Cycle mode construction from aligned bandpass swing waves
- 2013Stacked swing lows and breakout retrace tests
- 2015Building swing charts from perceptually important points
- 2015Construct a zztop from perceptually important points
- 2016Isolating swings with percentage trend thresholds