2004issue C091-7
When a late trend bends: test the pause before sizing a reversal
A linear-scale Swing chart can make an unsustainable late-trend stretch more visible than a logarithmic scale. The historical workflow then used an extreme Average Directional Index reading and ATR position sizing so the same chart hypothesis did not become an oversized reversal.
- A linear price scale can make a near-vertical late-trend move more visible than a logarithmic scale, which can hide an unsustainable parabolic stretch.
- Average Directional Index and ATR are used together near climax conditions because one is scaled from 1 to 100 and the other is expressed in the symbol's own price units.
- Rising ATR and an extreme Average Directional Index imply larger dollar risk at higher prices, so position size is reduced as volatility and price climb.
- After an extreme move, first-dip continuation patterns often fail because participants shift from buying pullbacks to selling bounces.
Read the bend before naming the end
Editorial interpretation: a late-trend bend is a testable setup, not an automatic reversal. The first job is to decide whether linear-scale Swing chart geometry is showing a pause or a climax. Only then do Average Directional Index extremes and ATR position sizing keep that same chart hypothesis from becoming an oversized reversal.
This article restates a historical workflow. It does not recommend a trade.
Linear scale can reveal a late-trend stretch
A linear price scale can make a near-vertical late-trend move more visible than a logarithmic scale, which can hide an unsustainable parabolic stretch.
Editorial reading: if the stretch is obvious only on a linear scale, the chart is asking whether the move is still a pause inside the trend or a climax that cannot keep extending in a straight line.
TASER daily price on a linear scale, 2003–2004
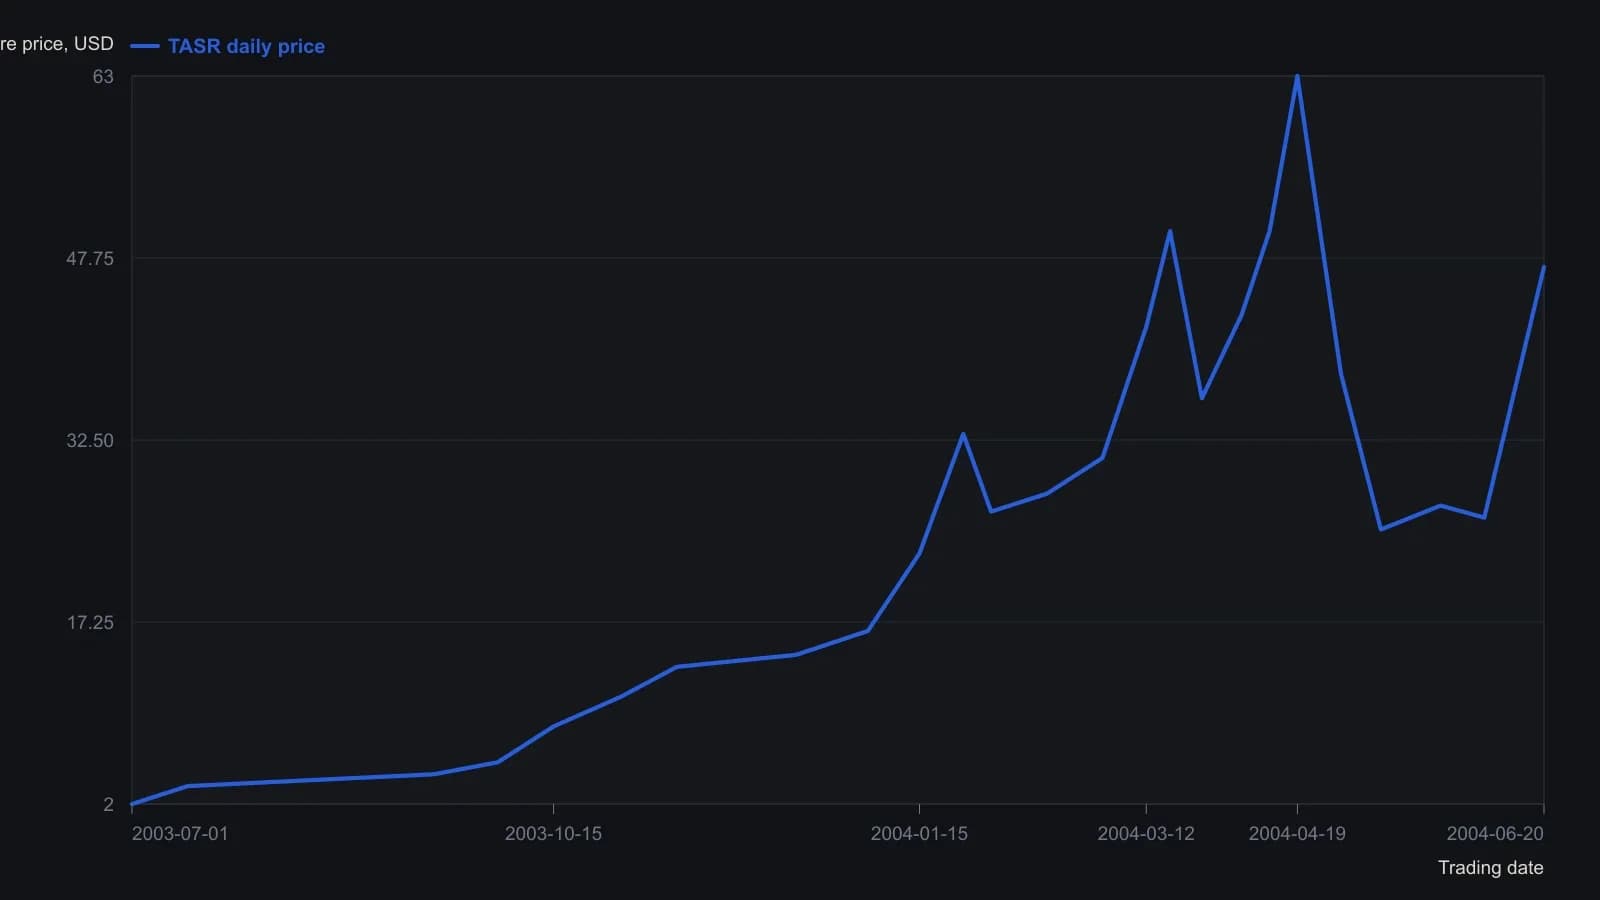
Unlabeled swing dates are placed to the nearest week on the monthly axis. Dollar levels are approximate raster readings, not a printed table. The companion logarithmic panel is the same closes under a different scale and is not a second series.
One daily spike, then a sharp decline
In one daily example, a linear-scale spike from mid-March to mid-April 2004 preceded a 60 percent decline between the April 19 high and the May 10 low.
A 14-period Average Directional Index reading above 50 at the April 19 top, together with a rapidly rising 5-period ATR, was used to confirm a visually obvious spike.
Swing chart geometry maps pause versus climax
Classic swing lines turn overlapping swings into a geometric map of congestion, prior support and resistance, and possible breakout retests.
A one-swing bull flag is defined as a pullback of no more than four bars after a breakout, while a two-swing flag shows overlapping swings that mark congestion.
Editorial interpretation: the same map decides whether the late-trend bend is a short, orderly flag or a climax that has already used up its straight-line run.
Average Directional Index and ATR sit on different scales
Average Directional Index and ATR are used together near climax conditions because Average Directional Index is scaled from 1 to 100 while ATR is expressed in the symbol's own price units.
Strong trends show Average Directional Index and ATR rising quickly over few bars, whereas congestion meanders with little net directional gain and often needs a long rest after exhaustion.
ATR position sizing shrinks as dollar risk rises
Rising ATR and extreme Average Directional Index imply larger dollar risk at higher prices, so position size is reduced as volatility and price climb.
Editorial interpretation: the size cut is not a second market call. It is how ATR position sizing keeps the original Swing chart hypothesis from becoming an oversized reversal if the climax fails.
First-dip continuation often fails after an extreme
After an extreme move, first-dip continuation patterns often fail because participants shift from buying pullbacks to selling bounces.
Editorial close: do not read the later 60 percent decline as proof that the method predicted an end of trend. The approved sequence is narrower. Linear-scale geometry made the spike visible, an Average Directional Index reading above 50 and a rapidly rising ATR confirmed it, and ATR position sizing reduced exposure as dollar risk climbed.
All readings on this track · 30 readings
- 1982Constructing range resistance from harmonic swing divisions
- 1984Gold swing chart: failed highs, wash-out, and a boxed pivot range
- 1988Remaining life on a percent-filtered swing chart
- 1991Ranking turning points with percentage swing filters
- 1991Five-count swing-chart construction and break rules
- 1992Constructing the Gann quarterly swing from the prior quarter's intraday range
- 1992Audit quarterly swing breakouts with a slower average cross
- 1992Weekly swing invalidation and the trailing stop
- 1992Quarterly swing chart construction and trend duration
- 1998A two-bar swing is unfinished until it names the stop
- 1999Multiple time-frame swing-channel trade setups
- 1999Separate two-bar swing direction from peak-valley trend
- 2000Constructing peak-trough swing reversals
- 2002Swing charts as shared grammar for trading mentorship
- 2002Confirming the last leg of a zigzag trend filter
- 2004When a late trend bends: test the pause before sizing a reversal
- 2006Crude oil swing counts and cycle clusters
- 2006When late rallies flatten: a swing-chart classroom
- 2006Relocating trading certainty to the decision process
- 2008Swing highs, bar-count pace, and the cost-price stop
- 2010Constructing suspect versus confirmed swing trends
- 2010Constructing swing charts from clear bar ranges
- 2010Building price force maps from two-bar swings
- 2010Clear-method swing-chart construction
- 2011Treat a squared-chart swing forecast as a same-day hypothesis
- 2012Cycle mode construction from aligned bandpass swing waves
- 2013Stacked swing lows and breakout retrace tests
- 2015Building swing charts from perceptually important points
- 2015Construct a zztop from perceptually important points
- 2016Isolating swings with percentage trend thresholds