2010issue C1198-100
Building price force maps from two-bar swings
Lock a two-bar swing first, then stack a retracement grid and natural price levels. A later breakout is judged against the resulting price clusters, which can fail.
- A two-bar swing starts only after two consecutive bars print higher highs or lower lows and ends only when the opposite two-bar condition appears.
- The retracement grid marks three-eighths, one-half, and five-eighths of that swing, and the halfway mark is the main check of whether the prior swing still has strength.
- Natural price levels are built from a chosen bar scale multiplied by 144, fitted to the active range, then divided by eight and by three.
- After a constructed level is broken on an hourly chart, leftover targets are still counted because market inertia can carry price toward those remaining marks.
Construction as a permission sequence
TradersWeek editorial note: treat this historical workflow as a permission sequence, not as a finished signal on a blank chart. The two-bar swing skeleton is locked first. Only after that segment exists are fractional retracements and scale-derived increments stacked. A later breakout is then judged against clustered force levels that can fail.
Lock the two-bar swing first
A two-bar swing starts only after two consecutive bars print higher highs or lower lows. That directional segment continues until a two-bar swing in the opposite direction appears. TradersWeek editorial note: later marks wait on this confirmation. Retracement and natural-level construction begins only after the originating swing is locked.
Stack the retracement grid
The construction marks retracements at three-eighths, one-half, and five-eighths of the locked swing. Three-eighths is treated as near the 0.382 Fibonacci ratio. Five-eighths is treated as near the 0.618 Fibonacci ratio. The halfway retracement is treated as the most common and most important check of whether the prior swing still has strength.
Add natural price levels
Natural price increments are built by multiplying a chosen bar scale by 144. That product may be doubled or quadrupled so it fits the active range. The fitted increment is then divided by eight and by three. TradersWeek editorial note: those eighths act as scale-derived octaves. They sit beside the retracement grid instead of replacing it.
Read overlap as a price cluster
Once the originating swing extreme is confirmed, overlapping retracement marks and natural-level marks form price clusters. Those clusters function as force points. TradersWeek editorial note: a later breakout is read against this clustered map. The clusters are allowed to fail. They are not treated as a blank-chart event.
May soybeans hourly: two-bar swings and 5/8–1/2 retracements
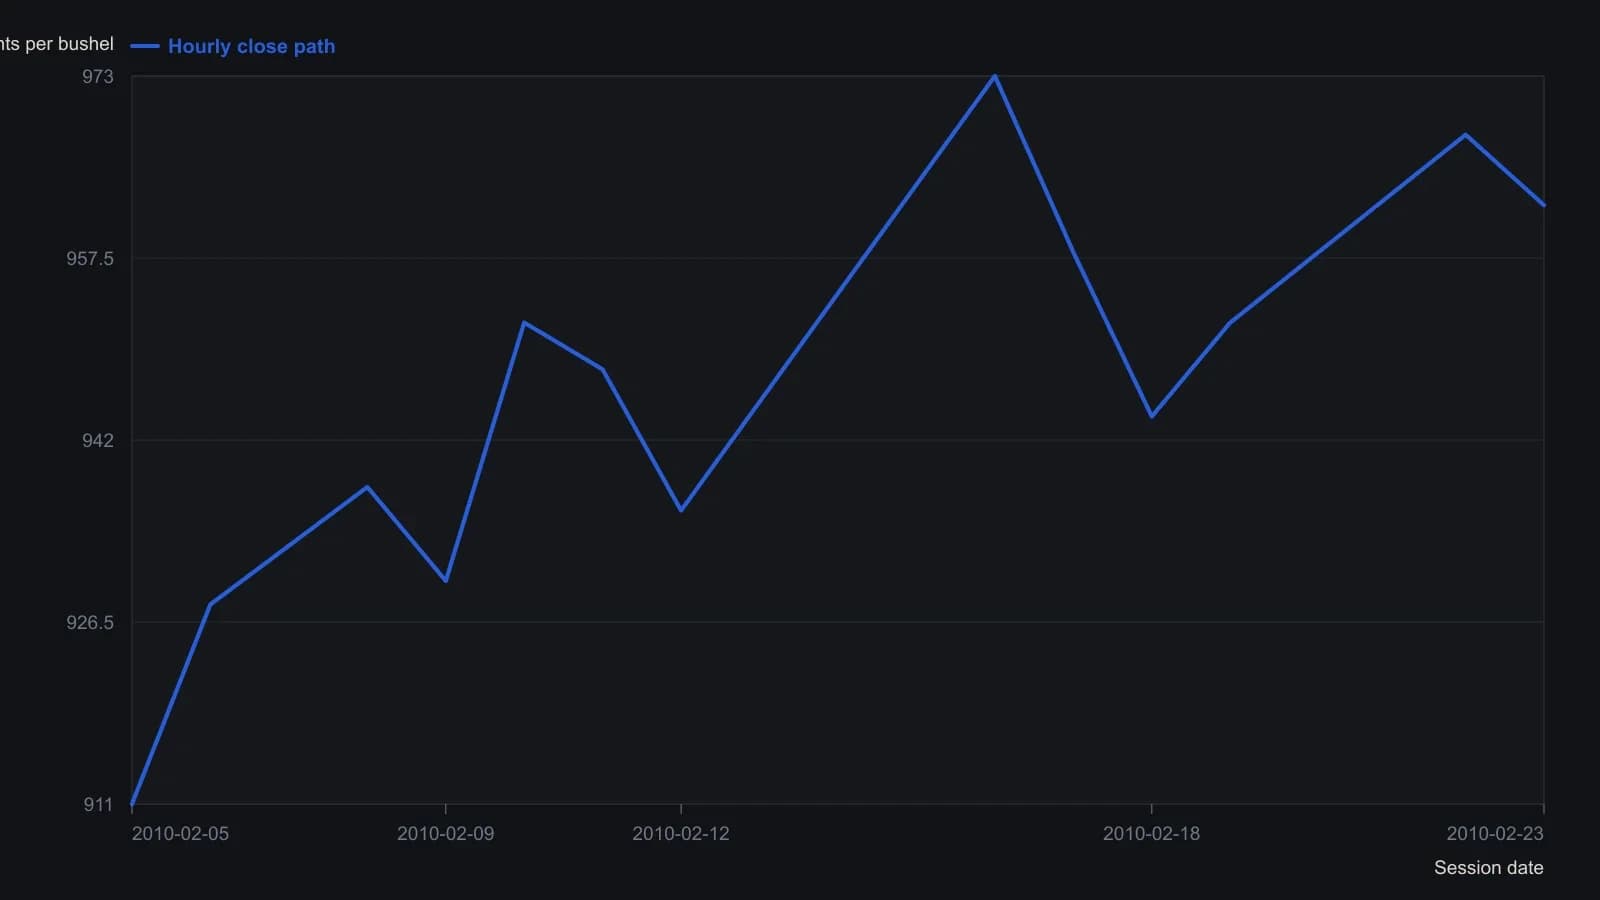
Prices are approximate readings from the printed hourly plot. The source labels the first pullback 5/8 and the next two 1/2; those are construction marks, not a separate price series. Scale used later in the article is 0.3 cents per bar.
What the walkthrough showed
In the walkthrough, the first material pullback reached the five-eighths mark. The next two pullbacks reached the 50% mark. TradersWeek editorial note: those touches are construction checks against the retracement grid, not a claim that every later swing must repeat the same path.
Leftover marks after a break
After a constructed level is broken on an hourly chart, remaining target prices are still counted. Market inertia can carry price toward those leftover marks.
All readings on this track · 30 readings
- 1982Constructing range resistance from harmonic swing divisions
- 1984Gold swing chart: failed highs, wash-out, and a boxed pivot range
- 1988Remaining life on a percent-filtered swing chart
- 1991Ranking turning points with percentage swing filters
- 1991Five-count swing-chart construction and break rules
- 1992Constructing the Gann quarterly swing from the prior quarter's intraday range
- 1992Audit quarterly swing breakouts with a slower average cross
- 1992Weekly swing invalidation and the trailing stop
- 1992Quarterly swing chart construction and trend duration
- 1998A two-bar swing is unfinished until it names the stop
- 1999Multiple time-frame swing-channel trade setups
- 1999Separate two-bar swing direction from peak-valley trend
- 2000Constructing peak-trough swing reversals
- 2002Swing charts as shared grammar for trading mentorship
- 2002Confirming the last leg of a zigzag trend filter
- 2004When a late trend bends: test the pause before sizing a reversal
- 2006Crude oil swing counts and cycle clusters
- 2006When late rallies flatten: a swing-chart classroom
- 2006Relocating trading certainty to the decision process
- 2008Swing highs, bar-count pace, and the cost-price stop
- 2010Constructing suspect versus confirmed swing trends
- 2010Constructing swing charts from clear bar ranges
- 2010Building price force maps from two-bar swings
- 2010Clear-method swing-chart construction
- 2011Treat a squared-chart swing forecast as a same-day hypothesis
- 2012Cycle mode construction from aligned bandpass swing waves
- 2013Stacked swing lows and breakout retrace tests
- 2015Building swing charts from perceptually important points
- 2015Construct a zztop from perceptually important points
- 2016Isolating swings with percentage trend thresholds