1992issue C081-7
Audit quarterly swing breakouts with a slower average cross
A quarterly-range-breakout swing-chart flips when the studied average clears the prior quarter’s intraday-extreme, and more than one flip can occur inside a single quarter. This article reconstructs that mechanical-trading-system as flip bookkeeping, times each post-signal-extreme, and compares the record with a 39-week moving-average-crossover.
- A quarterly-range-breakout turns up when the studied average trades through the prior calendar quarter’s intraday high and stays up until that average trades through the prior quarter’s intraday low, using the fixed windows January through March, April through June, July through September, and October through December.
- The mechanical procedure needs a running log of each quarter’s intraday-extremes, because more than one flip can occur inside a single quarter and a newer qualifying high can replace the prior quarter’s high as the upside trigger.
- Of 93 completed signals, 28 (30 percent) made a swing high or low within 30 days, 22 (23.7 percent) did so within 15 calendar days, 10 (10.8 percent) did so within two calendar days, and six reversed on the same day; 14 of 47 down signals made their low within 15 days.
- The same evaluation judged a 39-week moving-average-crossover to produce a more usable record with smaller drawdowns, and it used the compiled flip dates as a watch window for other indicators rather than as a standalone short-entry rule.
Specify the quarterly flip
The archive workflow is a mechanical-trading-system: a fully specified procedure that maps market state into entry, exit, or abstention without discretionary overrides. The swing rule turns up when the studied average trades through the prior calendar quarter’s intraday high, and it stays up until that average trades through the prior quarter’s intraday low.
Those flip levels are the prior quarter’s intraday-extremes, meaning the highest high or lowest low printed inside the defined calendar window, including prints that are not closes. The windows themselves are fixed as January through March, April through June, July through September, and October through December. In this construction the swing-chart is a quarterly-range-breakout: it stays in force until price exceeds a defined prior extreme, then flips stance.
Update the trigger after an intra-quarter reversal
The mechanical procedure requires a running log of each quarter’s intraday-extremes because more than one flip can occur inside a single quarter.
After a down flip, the price that restores an up stance is the latest qualifying high. If the prior quarter’s high has already been exceeded in the current quarter, that newer high becomes the upside trigger for the rest of the quarter and into the next quarter.
The late-1991 sequence
In the late-1991 sequence, an up stance in force since 18 January flipped down when 2836.30 was broken on 11 December. The stance flipped back up when 3092.00 was crossed on 26 December.
The down-turn low printed on the same day as the sell flip.
Time the post-signal-extreme
A post-signal-extreme is the next swing high or low that appears after a flip, used to measure how quickly the new stance is tested. The compiled record contained 93 completed signals. Twenty-eight of them (30 percent) made a swing high or low within 30 days of the signal. Twenty-two (23.7 percent) did so within 15 calendar days. Ten (10.8 percent) did so within two calendar days. Six signals were reversed on the same day.
Across 47 recorded down signals, the interval from the down flip to the subsequent swing low ranged from zero to 747 days. Fourteen of those signals made their low within 15 days.
TradersWeek editorial reading: the audit question is how often the new stance is tested inside a short calendar window, not whether the flip is a complete short-entry rule.
How quickly a new low follows a quarterly sell
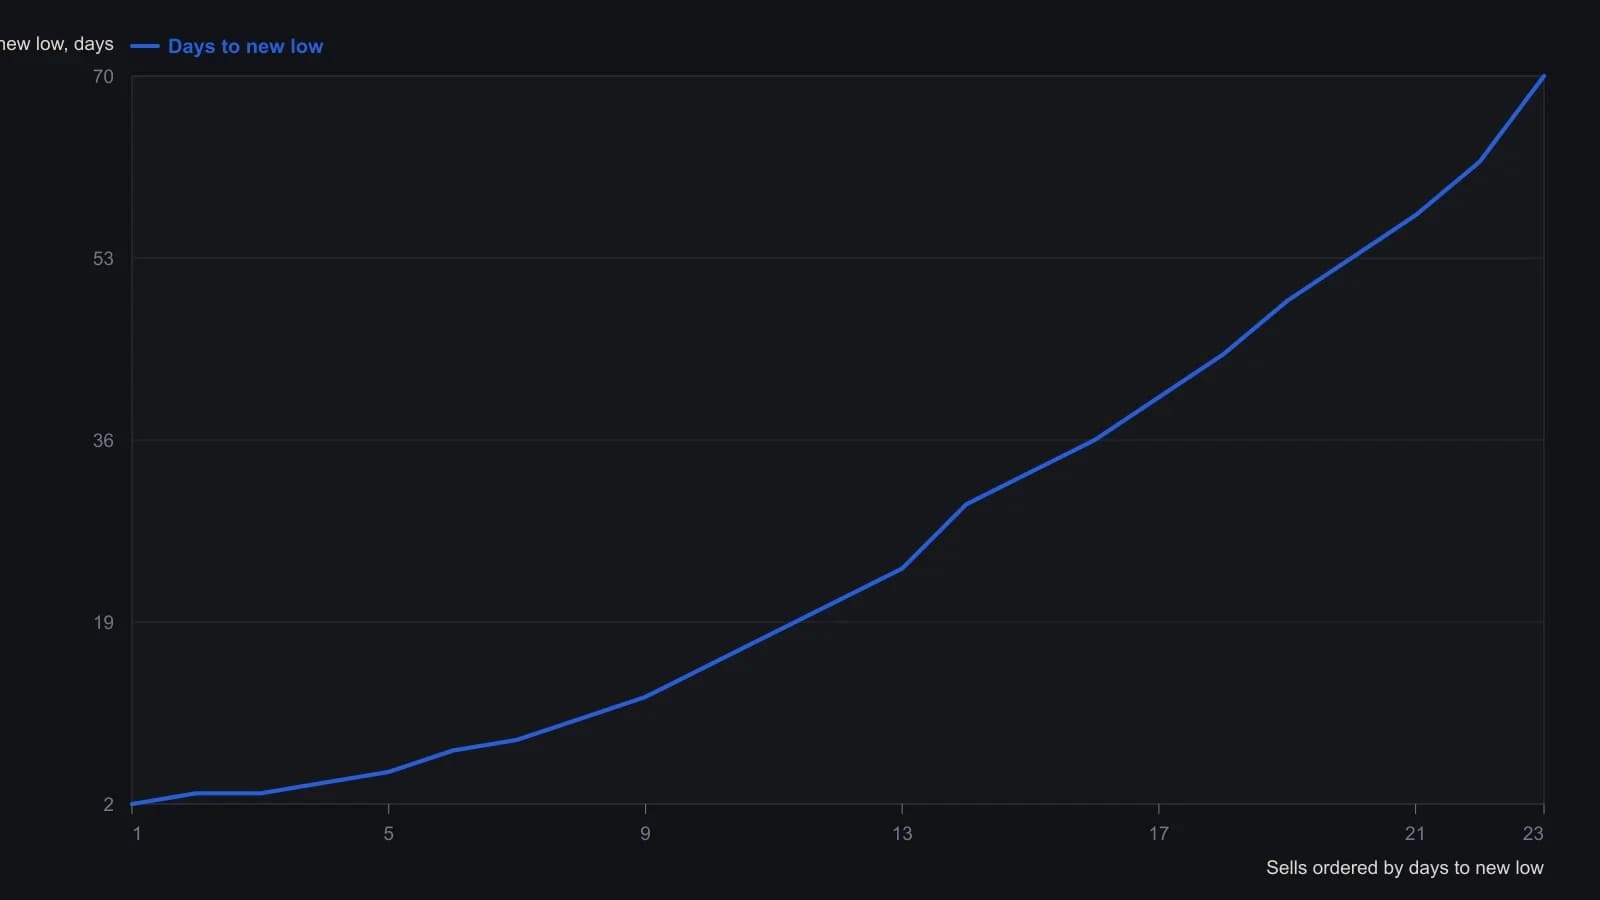
Printed columns rise from left to right, so they are treated as an ordered sample rather than calendar order. Heights are approximate to the raster and the 10-day grid; a one-day difference is not exact. The marked bar near rank 13 is the printed A callout.
Compare the flips with a 39-week average cross
The same long-horizon evaluation treated a 39-week moving-average-crossover as a simpler alternative procedure. A moving-average-crossover is a trend filter that changes stance when price or a faster average crosses a slower average. The evaluation judged that 39-week cross to produce a more usable record with smaller drawdowns than the quarterly swing flips.
TradersWeek editorial reading: the comparison asks whether the slower cross already does the same trend job with fewer failed swings.
Because a large share of down signals were followed by a nearby low, the compiled flip dates were also used as a watch window for other indicators rather than as a standalone short-entry rule.
The April 1992 stance
At the April 1992 observation date the swing-chart was up. The next down flip was defined as any penetration of the first-quarter low of 3120.00.
All readings on this track · 30 readings
- 1982Constructing range resistance from harmonic swing divisions
- 1984Gold swing chart: failed highs, wash-out, and a boxed pivot range
- 1988Remaining life on a percent-filtered swing chart
- 1991Ranking turning points with percentage swing filters
- 1991Five-count swing-chart construction and break rules
- 1992Constructing the Gann quarterly swing from the prior quarter's intraday range
- 1992Audit quarterly swing breakouts with a slower average cross
- 1992Weekly swing invalidation and the trailing stop
- 1992Quarterly swing chart construction and trend duration
- 1998A two-bar swing is unfinished until it names the stop
- 1999Multiple time-frame swing-channel trade setups
- 1999Separate two-bar swing direction from peak-valley trend
- 2000Constructing peak-trough swing reversals
- 2002Swing charts as shared grammar for trading mentorship
- 2002Confirming the last leg of a zigzag trend filter
- 2004When a late trend bends: test the pause before sizing a reversal
- 2006Crude oil swing counts and cycle clusters
- 2006When late rallies flatten: a swing-chart classroom
- 2006Relocating trading certainty to the decision process
- 2008Swing highs, bar-count pace, and the cost-price stop
- 2010Constructing suspect versus confirmed swing trends
- 2010Constructing swing charts from clear bar ranges
- 2010Building price force maps from two-bar swings
- 2010Clear-method swing-chart construction
- 2011Treat a squared-chart swing forecast as a same-day hypothesis
- 2012Cycle mode construction from aligned bandpass swing waves
- 2013Stacked swing lows and breakout retrace tests
- 2015Building swing charts from perceptually important points
- 2015Construct a zztop from perceptually important points
- 2016Isolating swings with percentage trend thresholds