2006issue C021-2
Crude oil swing counts and cycle clusters
This case uses light sweet crude to teach Gann-style energy timing as a two-scale count of calendar days between labeled swings. A date is treated as usable only when a short dominant-cycle length and a longer interval land together, so angles and swing-chart structure remain overlays.
- Count calendar days between labeled crude-oil highs and lows, and allow a slack of one or two days.
- Form a short dominant-cycle by comparing nearby legs, such as the 56-day and 54-day bullish spans and the 46-to-48-day band.
- Treat a date as usable only when independently measured short and long intervals coincide, as on the 20 May cluster of 161 days and 46 days.
- Keep Gann angles and swing-chart structure as overlays with stops and money management, not as standalone forecasts.
A winter demand backdrop on light sweet crude
The case used light sweet crude as the worked example and treated late-year northern-hemisphere winter demand as a seasonal-demand backdrop. Seasonal-demand here means a calendar-linked change in participation or volatility, used only as background for applying timing work to energy contracts.
Gann-style work was framed as joint price-and-time analysis that only helps when other market conditions are already present. Gann-angles, in that sense, are a price-and-time chart construct that turns historical high-low geometry into a timing or path hypothesis, not a guaranteed signal.
Day counts on the nearer oil chart
Turning-point timing was measured in calendar days between labeled highs and lows, with a slack of one or two days treated as acceptable. Two bullish legs on the nearer oil chart were counted at 56 days and 54 days. The remaining labeled ranges on that nearer chart completed inside a 46-to-48-day band.
A dominant-cycle is a candidate repeating horizon obtained by counting sampling intervals between ordered turning points and comparing nearby legs for similar length. Editorial reading: the 56-day and 54-day bullish legs, and the 46-to-48-day band, are that short-horizon comparison.
The wider chart and a cycle cluster
A wider chart of the same market showed successive turning-point spans of 163, 161, and 161 days. A cycle-cluster is a calendar date on which independently measured intervals of different length coincide. A 20 May date was presented as a cluster where a 161-day count and a 46-day count landed together.
Intervals first, then the swing chart
Identifying intervals was separated from execution. Swing charts, stops, and money management were named as the overlay for acting on a turn. A swing-chart is a reduced high-low map used to mark turns, attach cycle dates, and define invalidation for a trade hypothesis.
Light sweet crude: calendar days between labeled swings
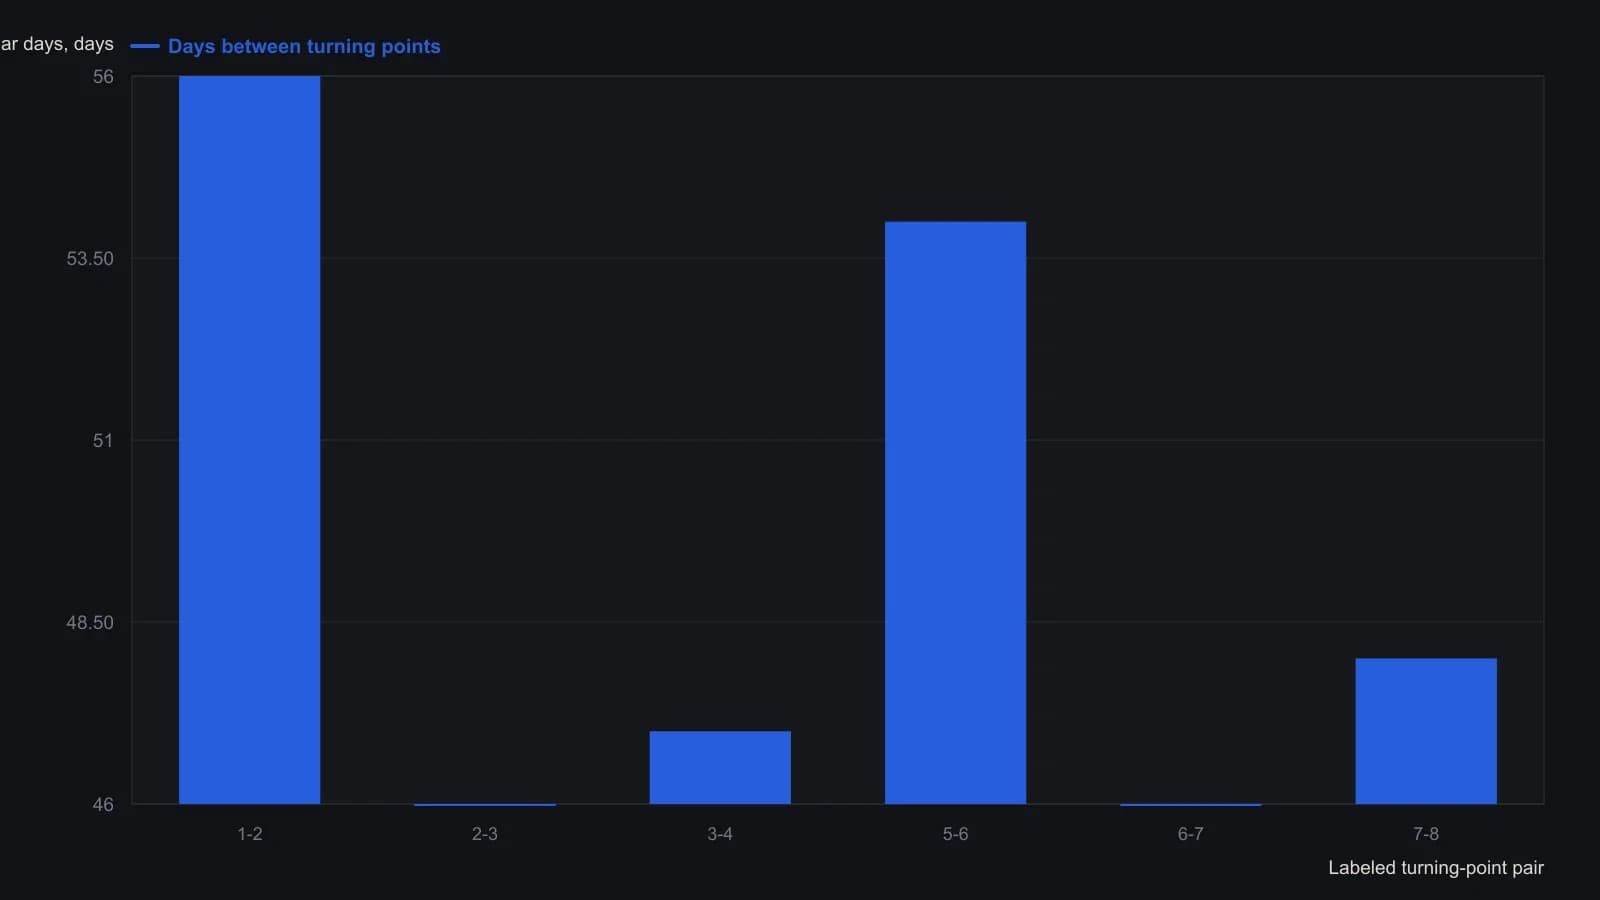
Swing 4-5 is omitted because the article only placed leftover swings inside a 46-48 day band and did not print a single length for that pair.
All readings on this track · 30 readings
- 1982Constructing range resistance from harmonic swing divisions
- 1984Gold swing chart: failed highs, wash-out, and a boxed pivot range
- 1988Remaining life on a percent-filtered swing chart
- 1991Ranking turning points with percentage swing filters
- 1991Five-count swing-chart construction and break rules
- 1992Constructing the Gann quarterly swing from the prior quarter's intraday range
- 1992Audit quarterly swing breakouts with a slower average cross
- 1992Weekly swing invalidation and the trailing stop
- 1992Quarterly swing chart construction and trend duration
- 1998A two-bar swing is unfinished until it names the stop
- 1999Multiple time-frame swing-channel trade setups
- 1999Separate two-bar swing direction from peak-valley trend
- 2000Constructing peak-trough swing reversals
- 2002Swing charts as shared grammar for trading mentorship
- 2002Confirming the last leg of a zigzag trend filter
- 2004When a late trend bends: test the pause before sizing a reversal
- 2006Crude oil swing counts and cycle clusters
- 2006When late rallies flatten: a swing-chart classroom
- 2006Relocating trading certainty to the decision process
- 2008Swing highs, bar-count pace, and the cost-price stop
- 2010Constructing suspect versus confirmed swing trends
- 2010Constructing swing charts from clear bar ranges
- 2010Building price force maps from two-bar swings
- 2010Clear-method swing-chart construction
- 2011Treat a squared-chart swing forecast as a same-day hypothesis
- 2012Cycle mode construction from aligned bandpass swing waves
- 2013Stacked swing lows and breakout retrace tests
- 2015Building swing charts from perceptually important points
- 2015Construct a zztop from perceptually important points
- 2016Isolating swings with percentage trend thresholds