1998issue C021-10
A two-bar swing is unfinished until it names the stop
The archive keeps market analysis and the trading plan as separate modalities, then binds them with a shorter swing definition, a hi-lo activator, and fixed action points. Editorial reading: a swing-chart call is incomplete until the same structure also names the trailing stop that would prove the idea wrong.
- Analysis can identify a change in trend or support, but the plan has to state the action. The two stay separate and must stay aligned.
- A valid plan names market direction, the tradable trend, support and resistance, action points, and money-management rules for capital, stops, profit protection, and position size.
- An upswing needs two consecutive higher highs, a downswing needs two consecutive lower lows, and the tradable trend flips only when price takes out the nearest peak or valley.
- The hi-lo activator both triggers entry and trails the position. A close through it, or a 38% retracement after price has already passed it, closes the trade.
Analysis is not the plan
A swing-chart marks successive highs and lows so trend direction and support or resistance can be read from price structure rather than from a single bar. In the archive workflow that reading is still only analysis. Market analysis and a trading plan are treated as separate modalities that must stay aligned: analysis can identify a change in trend or support, while the plan states the action to take.
A valid plan is defined as having at least market direction, tradable trend, support and resistance, action points, and money-management rules covering capital, stops, profit protection, and position size. Without fixed rules a plan cannot be backtested. A plan that failed to show a positive mathematical expectation in a backtest is described as unable to work later. Rule-based entry is the fixed procedure that states when to enter, exit, or stand aside so the whole plan can be checked as one process.
A two-bar swing checked by hand
A two-day swing definition was substituted for a three-day definition, then checked by hand on daily and intraday periods to see whether the shorter swing still supplied trend direction plus support and resistance. A mechanical plan is required to rest on a simple geometric, mathematical, or time basis, to avoid curve-fitting, and to remain able to change with the market.
How swing direction becomes a tradable trend
Swing direction turns up only after two consecutive higher highs and turns down only after two consecutive lower lows. An upswing is that change to upward swing direction. A downswing is the opposite change after two consecutive lower lows. An uptrend is recorded only when price takes out the nearest peak after a prior downtrend, and a downtrend only when price takes out the nearest valley after a prior uptrend. The tradable trend is the immediate swing direction used for action, which may differ from the broader market direction.
Support is the valley of the prior defined swing and resistance is its peak. A sequence of rising valleys is treated as a possible bottom warning and a sequence of dropping peaks as a possible top warning.
Long and short setups share one procedure
A long setup requires an uptrend plus a close above the hi-lo activator, then the first of three action points: a close above the activator, a swing change from downtrend to uptrend with the activator sell-stop below the bar, or a two-tick break of the nearest peak with that same stop below the bar. Shorts are the mirror image. The illustrated case takes trades only with the defined trend and notes that results will differ by market.
The same level trails the open risk
The hi-lo activator is a three-period average of highs or lows used as both entry trigger and trailing stop, plotted one period forward for the next session or from the live bar for same-day monitoring. After a buy setup the sell-stop trails rising bars, and a close through it is treated as a trend-change cue. A trailing stop follows favorable price and bounds loss or open exposure from before entry through the life of the position.
Open trades are closed on a close through the hi-lo activator, or on a 38% retracement of the current swing after price has already passed the activator, without waiting for the close.
Daily T-bond swing with the trailing hi-lo stop
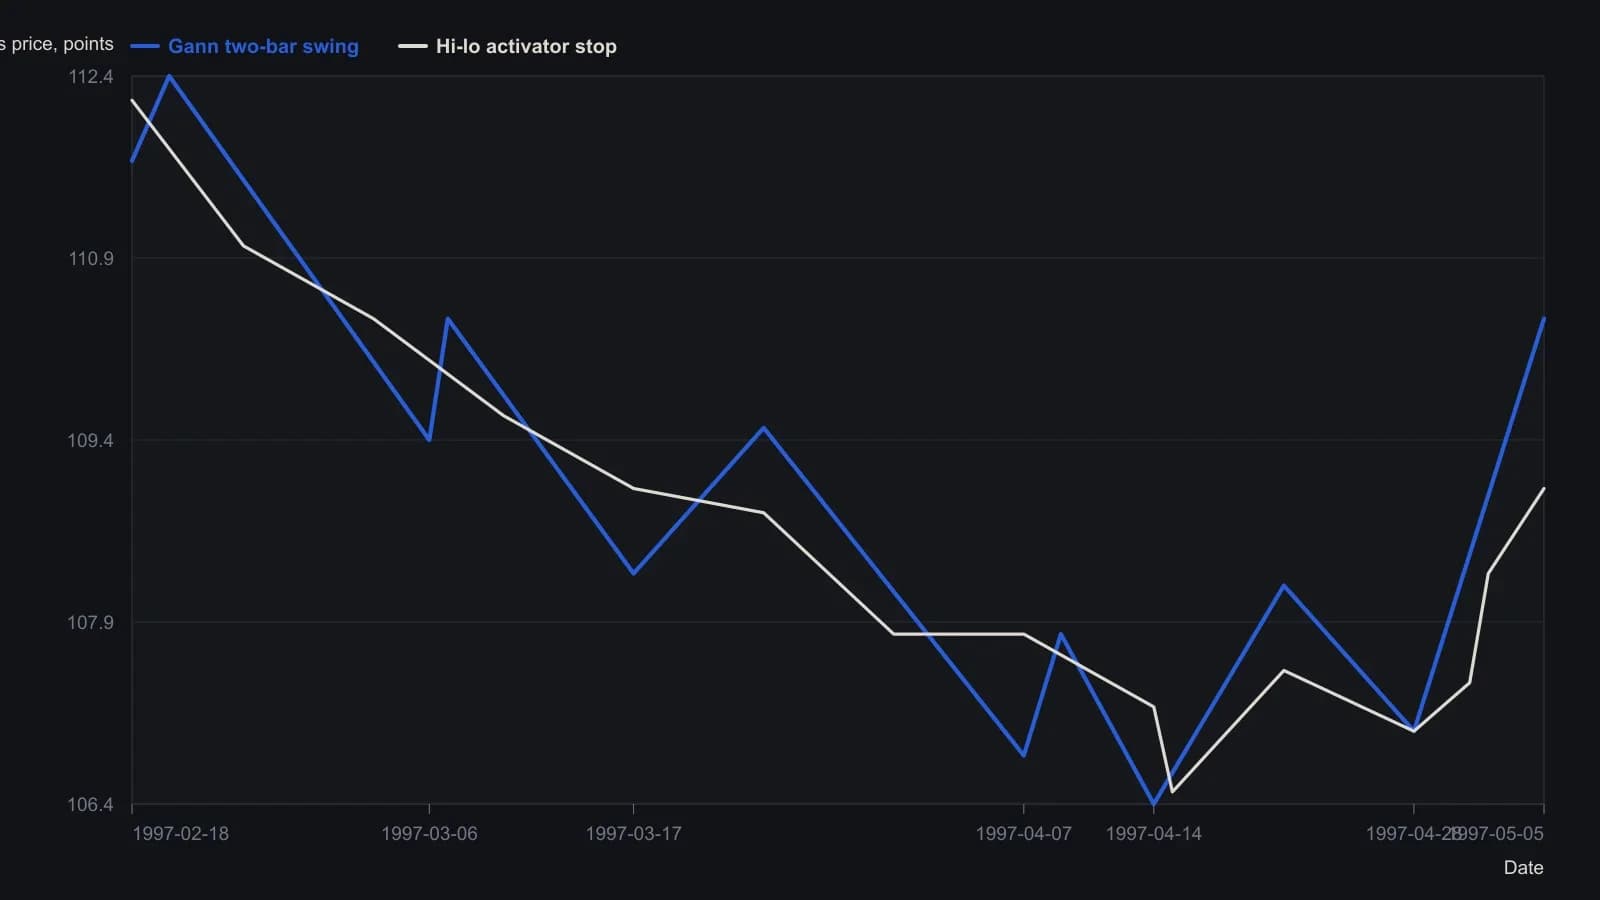
Swing uses the two-bar rule Gann wrote onto the 1933 course in 1955, not the original three-bar definition. The activator is a three-session average of highs or lows, drawn one session forward. Readings are from the raster, so prices are approximate to about a tenth of a point.
All readings on this track · 30 readings
- 1982Constructing range resistance from harmonic swing divisions
- 1984Gold swing chart: failed highs, wash-out, and a boxed pivot range
- 1988Remaining life on a percent-filtered swing chart
- 1991Ranking turning points with percentage swing filters
- 1991Five-count swing-chart construction and break rules
- 1992Constructing the Gann quarterly swing from the prior quarter's intraday range
- 1992Audit quarterly swing breakouts with a slower average cross
- 1992Weekly swing invalidation and the trailing stop
- 1992Quarterly swing chart construction and trend duration
- 1998A two-bar swing is unfinished until it names the stop
- 1999Multiple time-frame swing-channel trade setups
- 1999Separate two-bar swing direction from peak-valley trend
- 2000Constructing peak-trough swing reversals
- 2002Swing charts as shared grammar for trading mentorship
- 2002Confirming the last leg of a zigzag trend filter
- 2004When a late trend bends: test the pause before sizing a reversal
- 2006Crude oil swing counts and cycle clusters
- 2006When late rallies flatten: a swing-chart classroom
- 2006Relocating trading certainty to the decision process
- 2008Swing highs, bar-count pace, and the cost-price stop
- 2010Constructing suspect versus confirmed swing trends
- 2010Constructing swing charts from clear bar ranges
- 2010Building price force maps from two-bar swings
- 2010Clear-method swing-chart construction
- 2011Treat a squared-chart swing forecast as a same-day hypothesis
- 2012Cycle mode construction from aligned bandpass swing waves
- 2013Stacked swing lows and breakout retrace tests
- 2015Building swing charts from perceptually important points
- 2015Construct a zztop from perceptually important points
- 2016Isolating swings with percentage trend thresholds