1992issue C011-4
Constructing the Gann quarterly swing from the prior quarter's intraday range
A Gann quarterly chart is built by carrying the prior calendar quarter's intradaily extremes forward as a swing box. The long-horizon trend hypothesis changes only when the Dow Jones Industrial Average trades through that box, not when it merely clears the prior quarter's close.
- Construct a quarterly upturn only when the Dow Jones Industrial Average trades above the prior calendar quarter's intradaily high, not merely above that quarter's closing high.
- Keep the constructed trend up until the average trades below the prior quarter's intradaily low; that breach is what constructs a quarterly downturn.
- Follow the four calendar quarters and carry each quarter's intradaily high and low forward as the swing box the next quarter must break.
- After any quarterly upturn or downturn, a short-term high or low is described as typically forming within one to three days.
Treat the quarterly swing as a construction drill
The Gann quarterly chart is a long-horizon swing construction. It stays in force until the current quarter takes out the prior quarter's true high or true low.
Editorial: treat the method as a construction drill. Freeze the prior calendar quarter into a swing box of that quarter's full high-to-low range, then let only an intradaily break of that box rewrite the long-horizon trend hypothesis.
Freeze the prior calendar quarter as a swing box
The swing boxes follow the calendar quarters January to March, April to June, July to September, and October to December. Each new quarter requires the prior quarter's intradaily high and low to be carried forward.
That carried range is the swing box. It is the channel the next quarter must break before the trend hypothesis can change.
An intradaily extreme is the highest high or lowest low printed during a session, as distinct from the settlement print. The construction uses those session extremes, not the close alone.
How the upturn and downturn are constructed
A quarterly upturn begins when price trades through the prior quarter's intradaily high. The constructed trend then stays up until the average trades below the prior quarter's intradaily low.
That downside breach is what constructs a quarterly downturn.
On the weekly Dow Jones Industrial Average chart used to illustrate the method, a buy mark is placed when price exceeds the previous quarter's intradaily high. A sell mark is placed when price breaks the previous quarter's intradaily low.
Two 1980 cases that show the rule
The first-quarter 1980 intradaily high of 918.17 on February 13 was not exceeded during the second quarter, so no quarterly upturn was constructed that quarter.
The third-quarter 1980 upturn was constructed on July 7 when the average reached 896.34, one hundredth above the second-quarter intradaily high of 896.33 printed on June 26.
The 1991 downturn threshold
In the 1991 write-up, a downturn of the then-current quarterly uptrend was specified only on a break of 2836.31 intradaily during the October to December quarter.
What typically follows a constructed turn
After any quarterly upturn or downturn, a short-term high or low is described as typically forming within one to three days.
Gann quarterly swing turns on the DJIA, 1980–1991
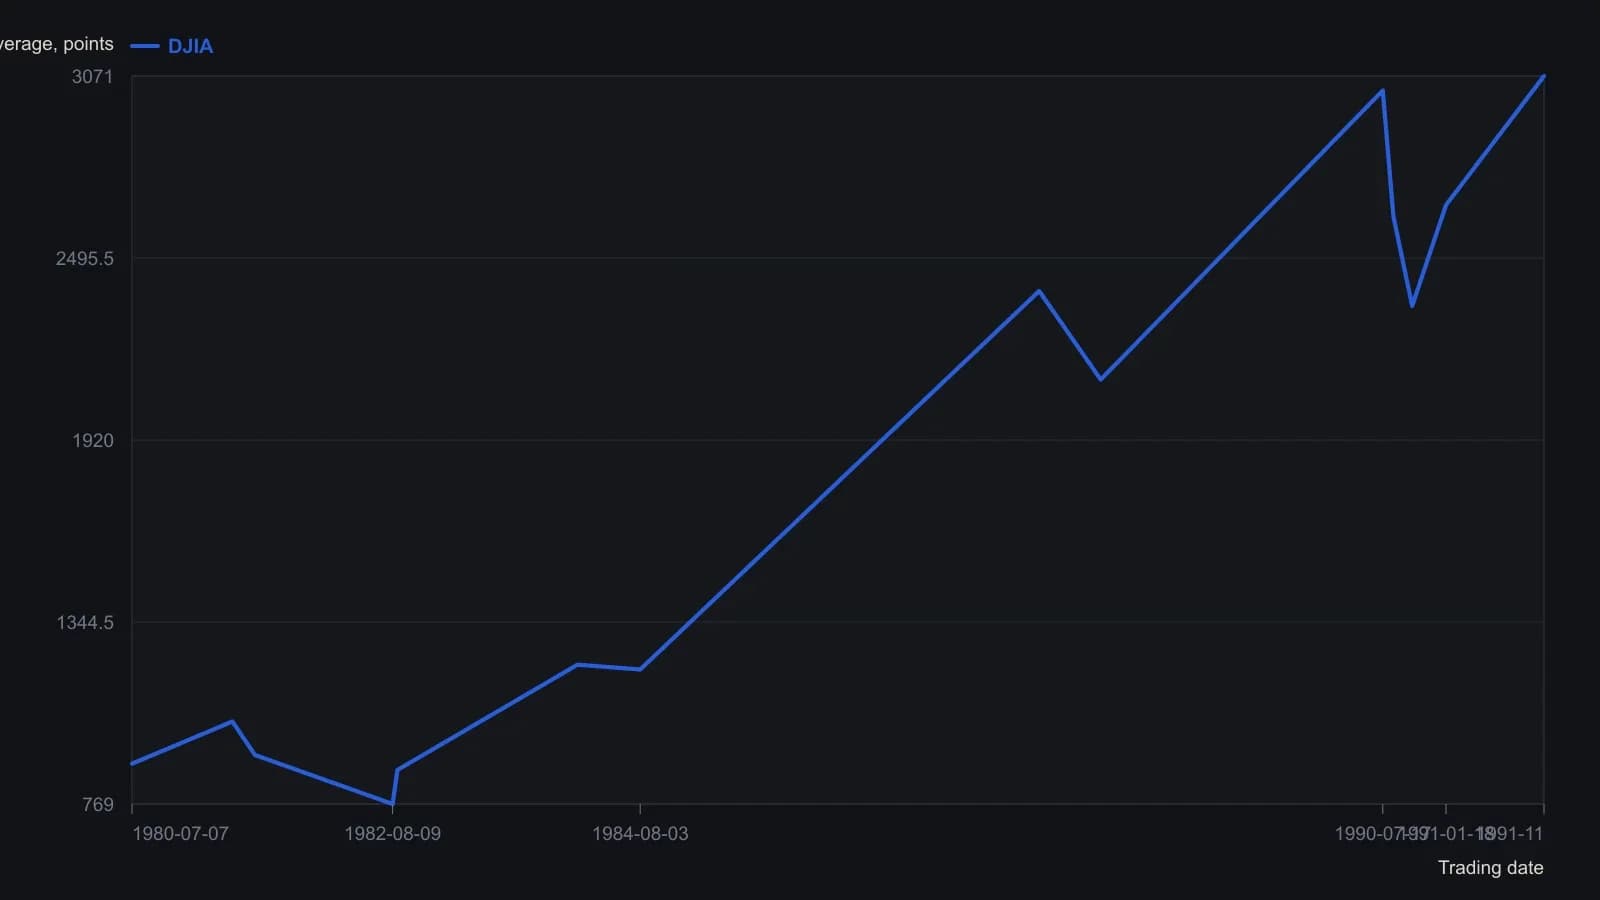
Each turn is an intradaily break of the prior calendar quarter's extreme, not a break of that quarter's close. The article does not date the 1987 bull-market peak or the crash low, so those episodes are not interpolated.
All readings on this track · 30 readings
- 1982Constructing range resistance from harmonic swing divisions
- 1984Gold swing chart: failed highs, wash-out, and a boxed pivot range
- 1988Remaining life on a percent-filtered swing chart
- 1991Ranking turning points with percentage swing filters
- 1991Five-count swing-chart construction and break rules
- 1992Constructing the Gann quarterly swing from the prior quarter's intraday range
- 1992Audit quarterly swing breakouts with a slower average cross
- 1992Weekly swing invalidation and the trailing stop
- 1992Quarterly swing chart construction and trend duration
- 1998A two-bar swing is unfinished until it names the stop
- 1999Multiple time-frame swing-channel trade setups
- 1999Separate two-bar swing direction from peak-valley trend
- 2000Constructing peak-trough swing reversals
- 2002Swing charts as shared grammar for trading mentorship
- 2002Confirming the last leg of a zigzag trend filter
- 2004When a late trend bends: test the pause before sizing a reversal
- 2006Crude oil swing counts and cycle clusters
- 2006When late rallies flatten: a swing-chart classroom
- 2006Relocating trading certainty to the decision process
- 2008Swing highs, bar-count pace, and the cost-price stop
- 2010Constructing suspect versus confirmed swing trends
- 2010Constructing swing charts from clear bar ranges
- 2010Building price force maps from two-bar swings
- 2010Clear-method swing-chart construction
- 2011Treat a squared-chart swing forecast as a same-day hypothesis
- 2012Cycle mode construction from aligned bandpass swing waves
- 2013Stacked swing lows and breakout retrace tests
- 2015Building swing charts from perceptually important points
- 2015Construct a zztop from perceptually important points
- 2016Isolating swings with percentage trend thresholds