2008issue C091-2
Swing highs, bar-count pace, and the cost-price stop
This article restates one illustrated 2007 index sequence from the archive. Editorial frame: treat it as a classroom drill in which a reversal is named only after qualified swing highs and lows are marked, market pace is counted in bars, and one stop path is written from the last opposite swing to cost.
- A swing high is treated as relevant only after at least two bars print higher highs and higher lows, and some markets raise that bar count to three.
- Market pace is the number of days or bars between consecutive opposite swings; a three-day advance that recaptured a six-day decline was read as a still-strong uptrend.
- Once a swing trade is in profit, the documented rule moves the stop to cost, often after a 2% gain adjusted by the market, so an open gain cannot become a cash loss.
- On the illustrated 2007 sequence, a break of 14705 confirmed the downtrend, later structure trailed the short stop to 15069, and no long was allowed after 13779 until 15069 was crossed.
Read the sequence before naming the reversal
Editorial frame: TradersWeek uses the illustrated 2007 index sequence as a classroom drill. A reversal may be named only after qualified swing highs and swing lows are marked, market pace is counted in bars, and a single stop path is written that ratchets from the last opposite swing to cost.
The archive describes a swing-chart as a price map drawn from those qualified highs and lows on open-high-low-close structure rather than from derived indicators. Swing-trading is the procedure that then states when to enter, when to exit, and when to stand aside from those swings.
How a swing high or swing low qualifies
A swing high is a peak treated as relevant only after a minimum run of higher-high and higher-low bars. The archive treats that peak as relevant only after at least two bars print higher highs and higher lows. Some markets raise that requirement to three bars.
A swing low is a trough treated as relevant only after a minimum run of lower-low and lower-high bars.
The 2007 index sequence
On the illustrated 2007 index chart, the August 6 low at 14705 was followed by three days of higher highs and higher lows and an August 9 swing high at 15542.
A break of 14705 on August 10 was used as downtrend confirmation: longs were to be closed and any short carried a stop at the 15542 swing high.
After the August 14 swing high at 15069, a break of the August 10 low at 14570 was the trigger to trail the short stop to 15069.
After the August 17 low at 13779, no long was allowed until 15069 was crossed, and that long used 13779 as its stop.
BSE Sensex, July–December 2007
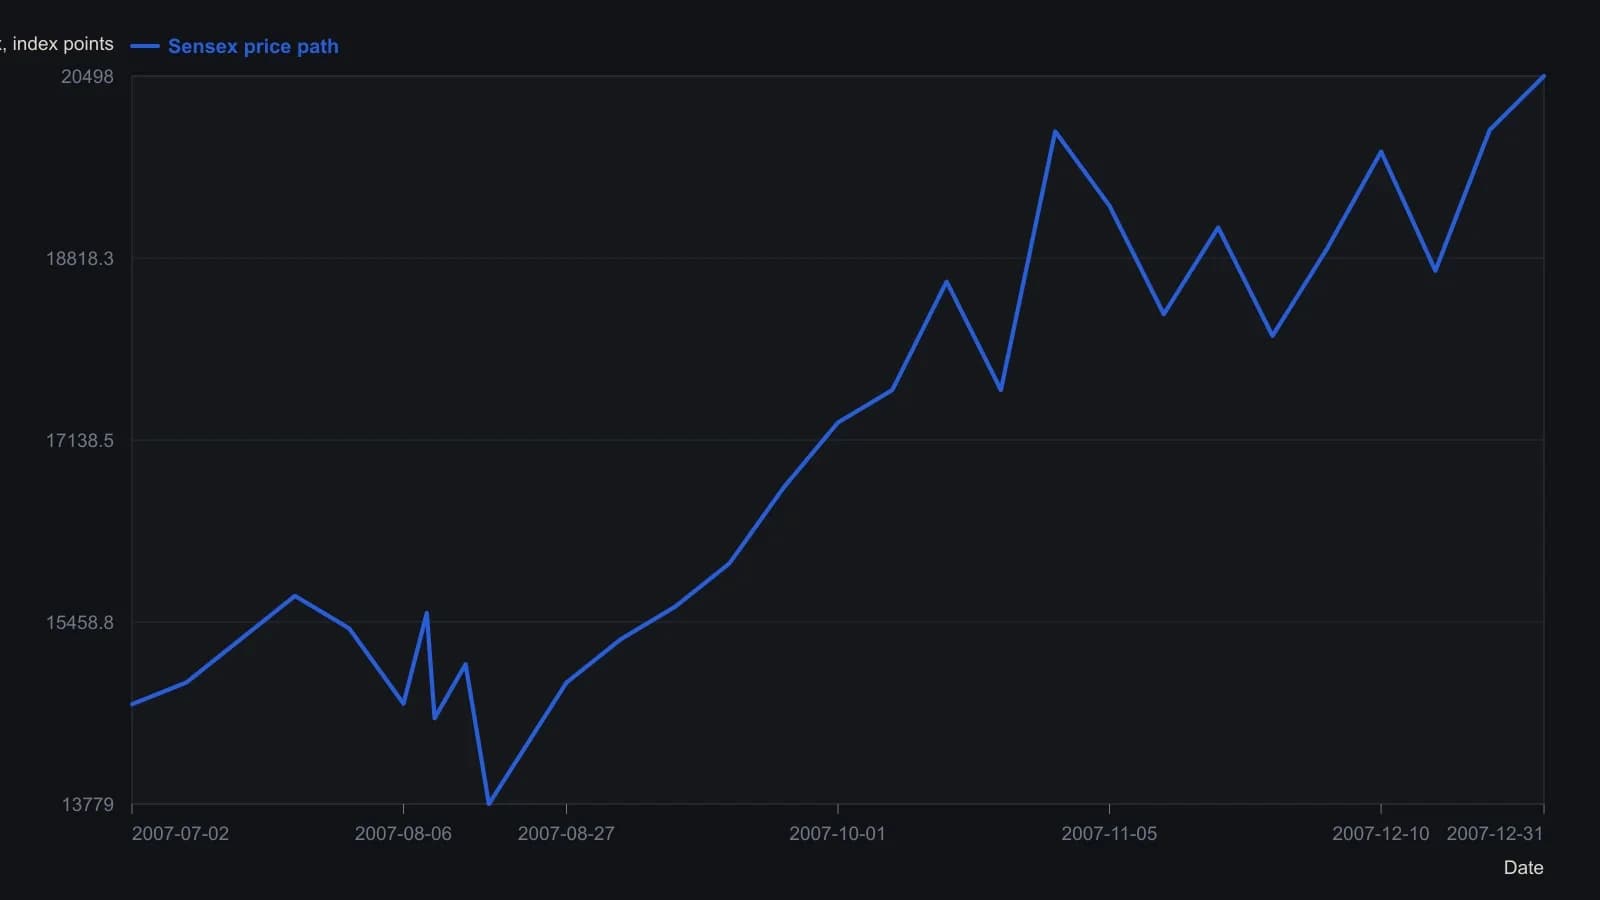
Labeled levels 13779, 14570, 14705, 15069, 15542, 19987 and 20498 are the printed callouts. Other points are weekly visual readings on the figure’s 13500–21000 scale and are approximate.
Market pace from the bar count
Market pace is the number of days or bars required to travel between consecutive opposite swings.
A three-day advance that recaptured a six-day decline was read as a still-strong uptrend. After a high of 19987, a decline that took more than three days to reach the prior low was classified as lacking strength and as a condition for considering a long near that low.
Trail the stop, then move it to cost
A trailing-stop is a protective level moved only in the trade's favor as structure or open profit changes. In the August sequence the short first carried a stop at 15542. After the later structure break, that stop was trailed to 15069.
Once a swing trade is in profit, the documented rule moves the stop to cost so an open gain cannot become a loss. A cost-price stop is that move to the entry price, so an open gain cannot become a cash loss. A common threshold is a 2% gain, adjusted by the market being traded. The two-percent rule is that market-dependent threshold.
All readings on this track · 30 readings
- 1982Constructing range resistance from harmonic swing divisions
- 1984Gold swing chart: failed highs, wash-out, and a boxed pivot range
- 1988Remaining life on a percent-filtered swing chart
- 1991Ranking turning points with percentage swing filters
- 1991Five-count swing-chart construction and break rules
- 1992Constructing the Gann quarterly swing from the prior quarter's intraday range
- 1992Audit quarterly swing breakouts with a slower average cross
- 1992Weekly swing invalidation and the trailing stop
- 1992Quarterly swing chart construction and trend duration
- 1998A two-bar swing is unfinished until it names the stop
- 1999Multiple time-frame swing-channel trade setups
- 1999Separate two-bar swing direction from peak-valley trend
- 2000Constructing peak-trough swing reversals
- 2002Swing charts as shared grammar for trading mentorship
- 2002Confirming the last leg of a zigzag trend filter
- 2004When a late trend bends: test the pause before sizing a reversal
- 2006Crude oil swing counts and cycle clusters
- 2006When late rallies flatten: a swing-chart classroom
- 2006Relocating trading certainty to the decision process
- 2008Swing highs, bar-count pace, and the cost-price stop
- 2010Constructing suspect versus confirmed swing trends
- 2010Constructing swing charts from clear bar ranges
- 2010Building price force maps from two-bar swings
- 2010Clear-method swing-chart construction
- 2011Treat a squared-chart swing forecast as a same-day hypothesis
- 2012Cycle mode construction from aligned bandpass swing waves
- 2013Stacked swing lows and breakout retrace tests
- 2015Building swing charts from perceptually important points
- 2015Construct a zztop from perceptually important points
- 2016Isolating swings with percentage trend thresholds