1982issue C051-4
Constructing range resistance from harmonic swing divisions
Take a completed swing high and low, mark the halfway 0.50 split with the 0.382 and 0.618 interior levels, and keep that same three-level grid on both a multi-year span and a short-term contract swing. Later reactions become a test of the constructed map rather than a prompt to draw support and resistance by eye.
- The three interior resistance divisions inside any completed high-low range are the halfway 0.50 mark plus the 0.382 and 0.618 proportional levels.
- Those same harmonic splits are used on both a major multi-year span and a minor contract swing.
- Range resistance is a neutralizing zone that can produce a reaction, a top or bottom consolidation, oscillation near the level, or an abrupt trend change.
- TradersWeek editorial reading: later swing reactions are a pass-or-fail test of the pre-marked map, not a reason to redraw support and resistance by eye.
Start from a completed high and low
Range resistance is a neutralizing zone built inside a completed high-low span. Isolate that span on a swing chart, a simplified path of successive highs and lows, so the range to be divided is fixed before any interior lines are drawn.
The three interior resistance divisions are the halfway 0.50 mark plus the 0.382 and 0.618 proportional levels. Those Fibonacci retracement splits, used with the halfway mark, are the basic three-level grid. The same harmonic divisions are presented as valid on both a major multi-year span and a minor contract swing.
Support and resistance in this workflow are testable reaction levels taken from prior extremes and those interior splits, not informal horizontal lines drawn by eye.
TradersWeek editorial reading: run this as a construction drill. Complete the swing, mark the same three splits on both the long span and the short-term chart, and hold that map while later swings either react at the levels or they do not.
Keep the construction inside range or space
Resistance is framed as a function of time and price space. It has three basic forms: resistance in price range, resistance in time, and resistance from price-to-price relationships. The construction here is limited to range or space resistance.
That range resistance is treated as a neutralizing third force. It can produce a reaction, a top or bottom consolidation, oscillation near the level, or an abrupt trend change.
Price action is classified as trending when supply and demand move from balance toward imbalance, and as consolidating when those forces move from imbalance toward equilibrium.
A multi-year wheat span
On a daily swing chart of May 1984 wheat, a 14-year range of 505 points from 1.25 to 6.30 produces a 0.50 level at 377½. A later minor triple bottom printed at 377, 377½, and 377 before a rally.
A minor soybean swing
On a daily swing chart of November 1983 soybeans, the range from 696½ to 604 is 92½ points, giving constructed interior levels of 661 at 0.618, 650¼ at 0.50, and 639 at 0.382.
Later soybean swings reacted near those constructed levels: a decline low near 660, a minor double bottom at 647½ and 649½, a rally top at 663, a low at 636, a rally to 649½, and a later swing back to 643.
Later reactions test the map
Both examples keep the interior grid fixed and then record how later swings behaved near the marked levels. TradersWeek editorial reading: that record is the pass-or-fail test of the map. The later highs and lows are compared with the pre-marked 0.382, 0.50, and 0.618 splits instead of prompting a new set of lines.
November 1983 soybeans test a constructed 0.382 / 0.50 / 0.618 range map
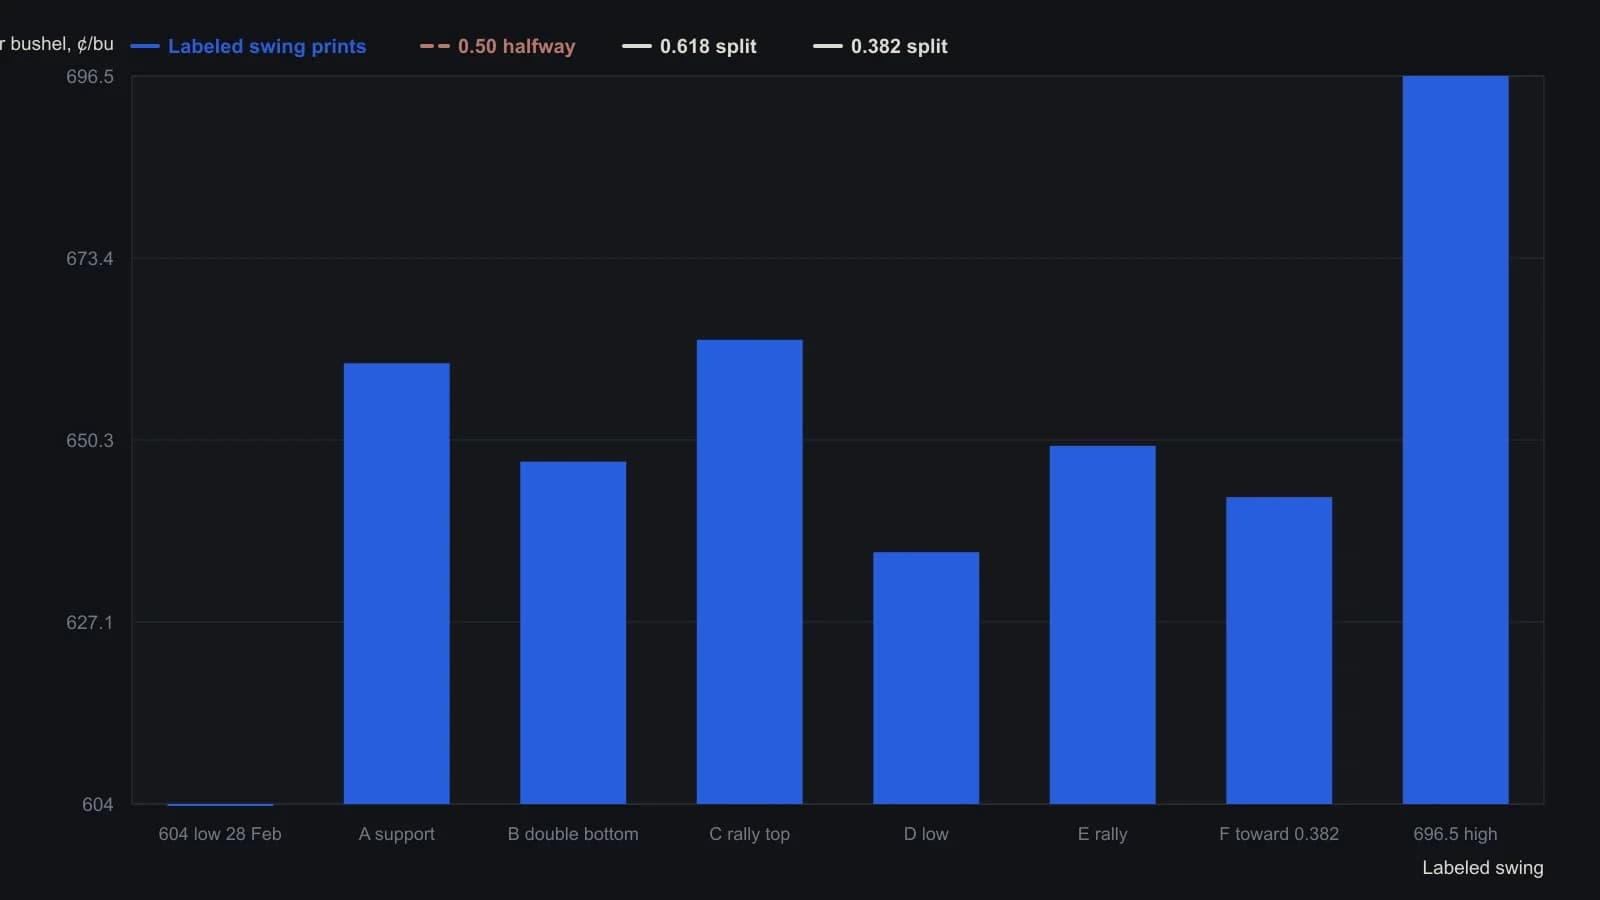
Range is 92.5 cents from the 604 low of 28 February to the 696.5 contract high. Interior splits are the article’s .382 / .50 / .618 of that range. Later prints are given as 1¢, 2¢, 3¢ or 4¢ off those levels.
All readings on this track · 30 readings
- 1982Constructing range resistance from harmonic swing divisions
- 1984Gold swing chart: failed highs, wash-out, and a boxed pivot range
- 1988Remaining life on a percent-filtered swing chart
- 1991Ranking turning points with percentage swing filters
- 1991Five-count swing-chart construction and break rules
- 1992Constructing the Gann quarterly swing from the prior quarter's intraday range
- 1992Audit quarterly swing breakouts with a slower average cross
- 1992Weekly swing invalidation and the trailing stop
- 1992Quarterly swing chart construction and trend duration
- 1998A two-bar swing is unfinished until it names the stop
- 1999Multiple time-frame swing-channel trade setups
- 1999Separate two-bar swing direction from peak-valley trend
- 2000Constructing peak-trough swing reversals
- 2002Swing charts as shared grammar for trading mentorship
- 2002Confirming the last leg of a zigzag trend filter
- 2004When a late trend bends: test the pause before sizing a reversal
- 2006Crude oil swing counts and cycle clusters
- 2006When late rallies flatten: a swing-chart classroom
- 2006Relocating trading certainty to the decision process
- 2008Swing highs, bar-count pace, and the cost-price stop
- 2010Constructing suspect versus confirmed swing trends
- 2010Constructing swing charts from clear bar ranges
- 2010Building price force maps from two-bar swings
- 2010Clear-method swing-chart construction
- 2011Treat a squared-chart swing forecast as a same-day hypothesis
- 2012Cycle mode construction from aligned bandpass swing waves
- 2013Stacked swing lows and breakout retrace tests
- 2015Building swing charts from perceptually important points
- 2015Construct a zztop from perceptually important points
- 2016Isolating swings with percentage trend thresholds