1999issue C101-5
Separate two-bar swing direction from peak-valley trend
A two-bar swing changes direction only after two consecutive higher highs or two consecutive lower lows, but trend state changes only when the nearest peak or valley is taken out. A long is considered only in that uptrend, and only when the three-bar high-low average supports it with a close through the visible average.
- A two-bar swing turns up only after two consecutive higher highs and turns down only after two consecutive lower lows.
- Trend state changes only when price takes out the nearest peak to turn up or the nearest valley to turn down, so a later two-bar downswing can form inside an uptrend.
- A long is considered only while the swing-defined trend is up, and a peak break that turns trend up is not a long if price never closes above the average of the highs.
- An open long or short is exited when price closes through the flipped high-low average.
This article describes a historical workflow for a two-bar swing, a peak-valley trend state, and a three-bar high-low average. A long is considered only while the swing-defined trend is already up, and a short is considered only while that trend is already down.
Two-bar swing direction
A two-bar swing turns up only after two consecutive higher highs and turns down only after two consecutive lower lows. Peaks and valleys are marked as the later swing-reversal points of that construction.
Peaks, valleys, and trend state
A peak is an upswing followed by a downswing. The nearest peak is the level that must be surpassed before the trend can turn up. A valley is a downswing followed by an upswing. The nearest valley is the level that must be taken out before the trend can turn down.
Trend state changes only when price takes out the nearest peak to turn up or the nearest valley to turn down. After a peak is surpassed, a later two-bar downswing can form without changing the uptrend until a valley is taken out.
Amazon.com two-bar Gann swing on 30-minute bars
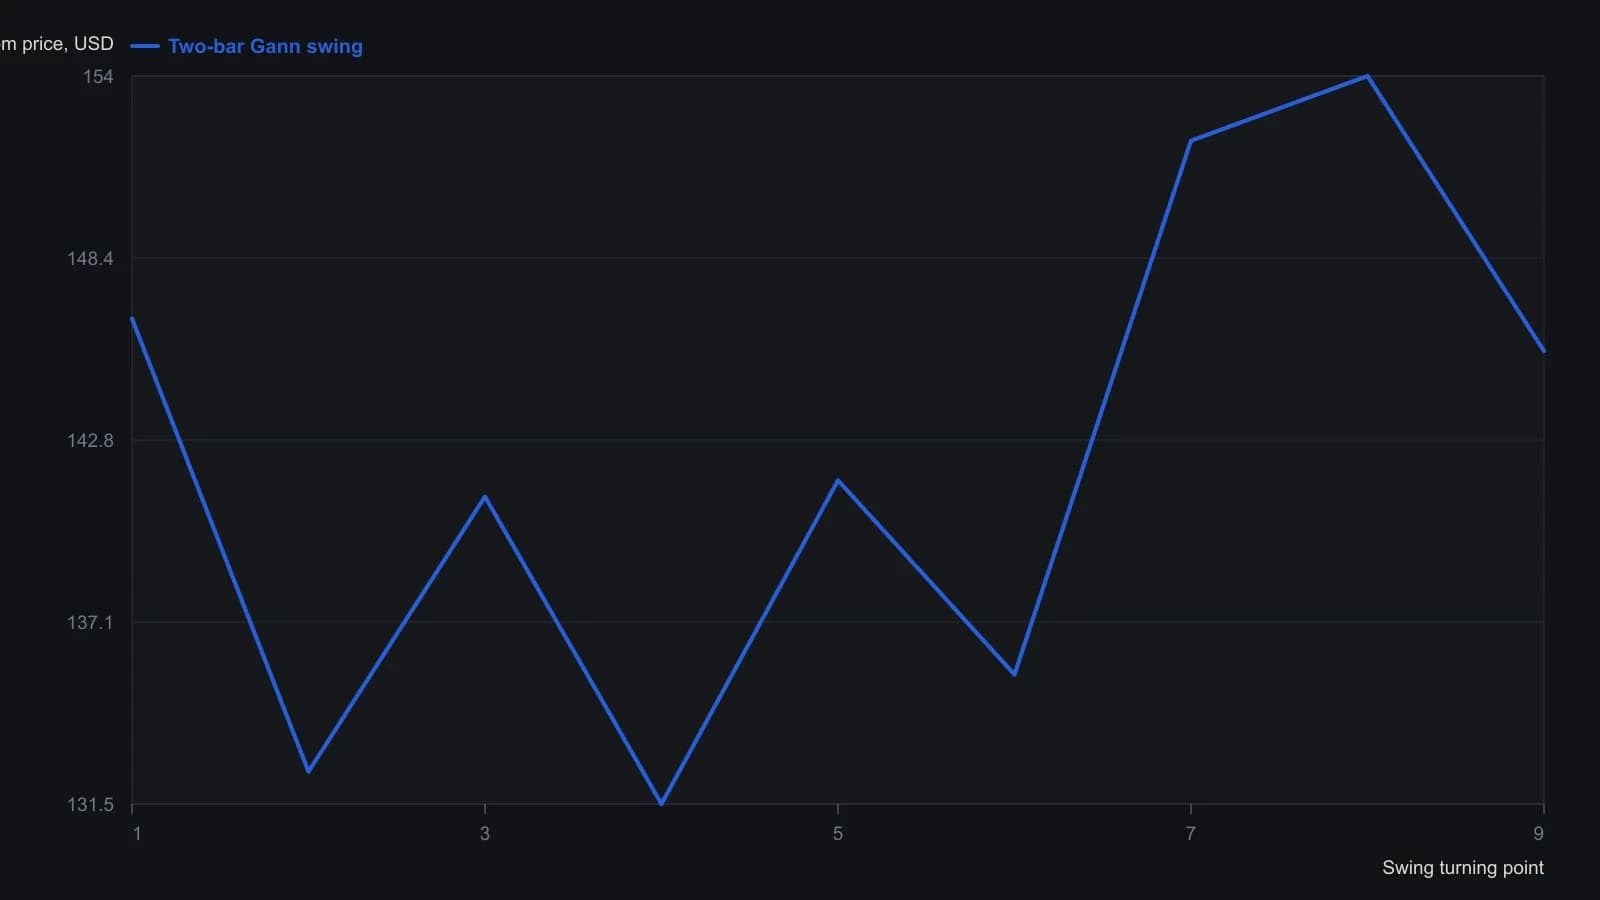
No printed table; values are swing-overlay turning points read to the nearest half dollar on a four-dollar grid. The 11 May high is the $154 peak named in the article. Order is left-to-right along the overlay, not a bar-by-bar close series.
The high-low activator
The high-low activator is a three-bar average of highs and a three-bar average of lows. The averages appear one at a time and flip only after a close through the visible average. Once the swing-defined trend is set, that visible average is the close-through confirmation and the trailing exit.
When a long is allowed
Uptrend entries are a close above the average of the highs, the first peak break that turns trend up, or a later surplus of the nearest peak by two ticks. Each of those cases requires the high-low average to support the long. A peak break that changes trend to up is not a long if price never closes above the average of the highs.
When an open position is exited
An open long or short is exited when price closes through the flipped high-low average.
All readings on this track · 30 readings
- 1982Constructing range resistance from harmonic swing divisions
- 1984Gold swing chart: failed highs, wash-out, and a boxed pivot range
- 1988Remaining life on a percent-filtered swing chart
- 1991Ranking turning points with percentage swing filters
- 1991Five-count swing-chart construction and break rules
- 1992Constructing the Gann quarterly swing from the prior quarter's intraday range
- 1992Audit quarterly swing breakouts with a slower average cross
- 1992Weekly swing invalidation and the trailing stop
- 1992Quarterly swing chart construction and trend duration
- 1998A two-bar swing is unfinished until it names the stop
- 1999Multiple time-frame swing-channel trade setups
- 1999Separate two-bar swing direction from peak-valley trend
- 2000Constructing peak-trough swing reversals
- 2002Swing charts as shared grammar for trading mentorship
- 2002Confirming the last leg of a zigzag trend filter
- 2004When a late trend bends: test the pause before sizing a reversal
- 2006Crude oil swing counts and cycle clusters
- 2006When late rallies flatten: a swing-chart classroom
- 2006Relocating trading certainty to the decision process
- 2008Swing highs, bar-count pace, and the cost-price stop
- 2010Constructing suspect versus confirmed swing trends
- 2010Constructing swing charts from clear bar ranges
- 2010Building price force maps from two-bar swings
- 2010Clear-method swing-chart construction
- 2011Treat a squared-chart swing forecast as a same-day hypothesis
- 2012Cycle mode construction from aligned bandpass swing waves
- 2013Stacked swing lows and breakout retrace tests
- 2015Building swing charts from perceptually important points
- 2015Construct a zztop from perceptually important points
- 2016Isolating swings with percentage trend thresholds