1992issue C091-5
Weekly swing invalidation and the trailing stop
A weekly swing chart turns up only after a trade above the prior week's high and stays up until a trade below a prior week's low. While that stance holds, the protective stop moves just beyond each newly confirmed swing extreme, and a stop through that extreme is treated as a reverse.
- The weekly swing chart turns up from an extreme low only after a trade above the immediately prior week's high, and it stays up until a trade below a prior week's low turns the map down.
- Longer-span swing charts are presented as stronger than shorter-span ones, so a weekly signal sits above a daily signal and below a monthly signal.
- While the weekly stance is up, the trailing stop is raised to just beneath each newly confirmed higher swing-chart bottom; a stop through that last extreme exits the long and opens a short.
- Narrow weekly ranges can produce brief whipsaw sequences, and each issue is described as needing at least a year of swing study because names display their own nuances.
One chart for the main trend
A weekly swing chart is a directional map of successive weekly extremes that flips only when the prior week's high or low is taken out, then runs to the next opposite extreme.
The weekly construction is presented as a trend-following device whose job is to identify the main trend and keep the stance aligned with that trend, whether the map is pointing up or down.
How the weekly turn is printed
A weekly swing chart is described as turning up from an extreme low only after the issue trades above the highest price recorded in the immediately prior week.
After an upward turn, the same weekly map is described as remaining up until price falls below the lowest price seen in a prior week, at which point the chart turns down.
A Gann-family timing method with a rank among time spans
The weekly swing chart is presented as one Gann-family timing method among many related swing constructions, each flipping on its own rule set, and as the single chart the writer would keep if forced to use only one.
Swing charts that cover longer time spans are presented as giving stronger directional signals than shorter-span swing charts, so a weekly signal is treated as stronger than a daily signal and weaker than a monthly signal.
In the sense used here, Gann angles are a Gann-pattern timing method that reads OHLC structure and chart scale to turn a repeatable condition into a directional hypothesis over horizons from a session to several weeks.
The stance follows higher bottoms, then higher tops
An uptrend is specified as higher bottoms and then higher tops, not merely higher tops followed by higher bottoms.
A break below a prior swing-chart bottom is treated as a signal of at least short-term lower prices and a possible change from uptrend to downtrend.
The main-trend-stance is the single long or short posture the weekly map is meant to keep aligned with that sequence, or with lower tops then lower bottoms when the map is pointing down.
Park the trailing stop just beyond the last confirmed extreme
While the weekly stance is up, the protective stop is raised to just beneath each newly confirmed higher swing-chart bottom. While the stance is down, the stop is lowered to just above each successive lower swing-chart top.
The trailing stop parks invalidation just beyond the last confirmed swing extreme and moves only when a newer extreme in the same direction is printed.
Treat a stop through the last extreme as a reverse
A stop through the last swing extreme is treated as a reverse: the long is exited and a short is opened with the new stop just above the prior swing top, or the mirror process is used after a short is stopped.
That stop-and-reverse rule both exits the open stance and opens the opposite stance, with the new stop placed just beyond the prior opposite extreme.
The weekly walk-through
In the weekly walk-through, a decline through the prior week's low of 39 flipped the chart down, and the map stayed down until a later week exceeded the immediately preceding week's high.
Editorial note: construction comes first in that sequence. The down flip is the invalidation of the prior up stance. Only after that print would the trailing stop be walked down just above each new lower swing-chart top, and only a later trade above the immediately preceding week's high would reverse the map again.
House of Fabrics daily prices, 28 October–15 November 1991
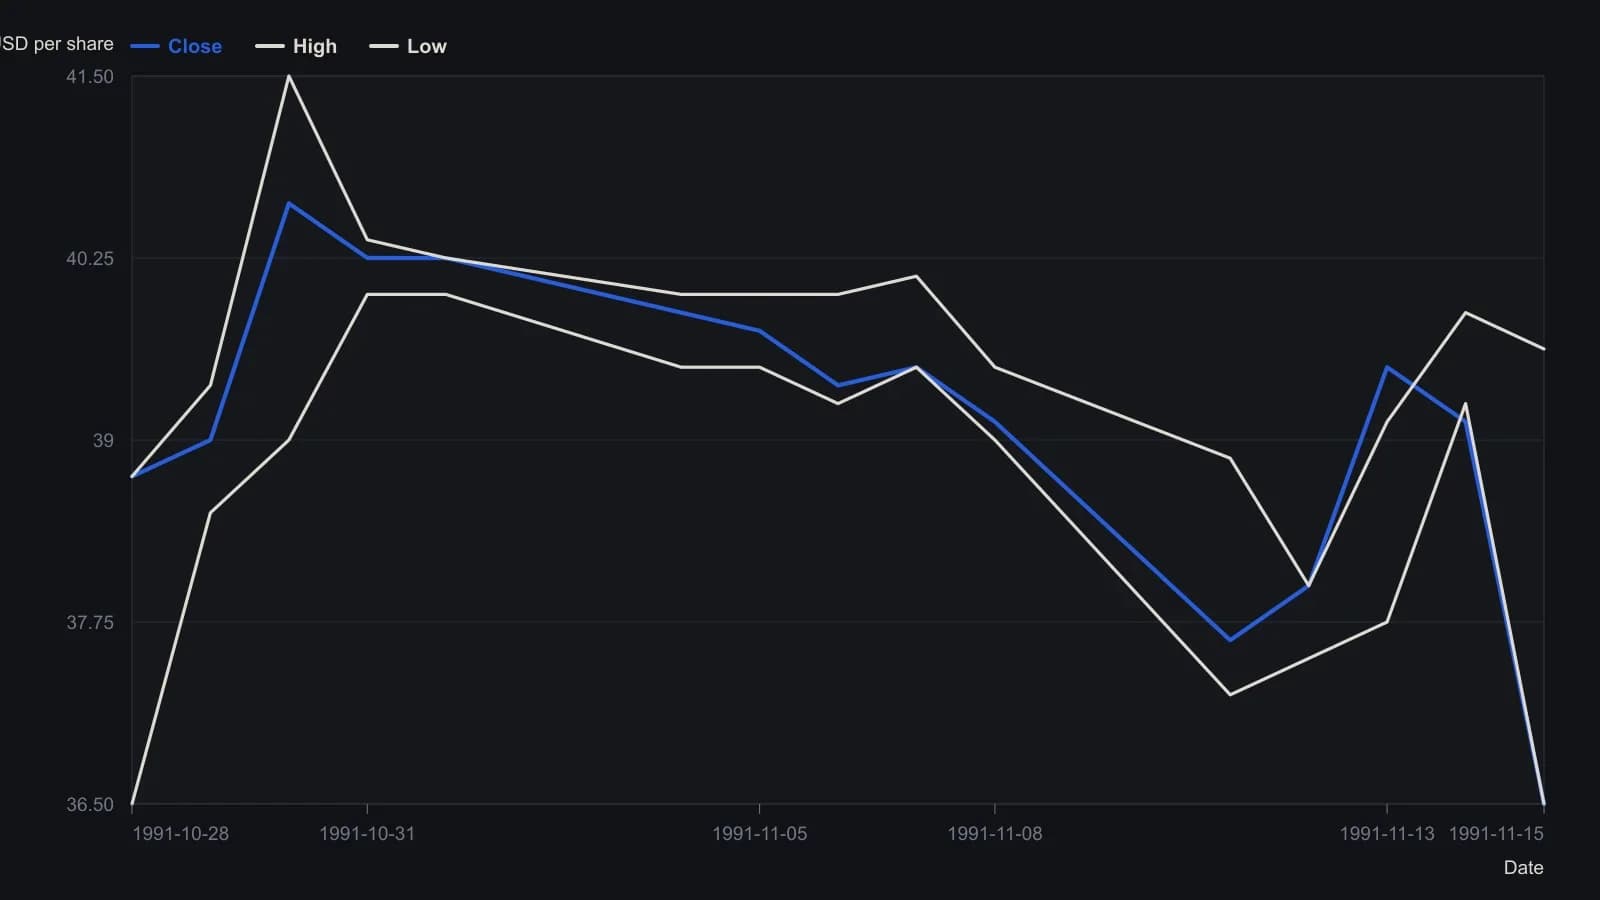
Prices are converted from the source's eighths. The 13 November row is printed with a 39.50 close above a 39.125 high; that inconsistency is in the table, not an edit. The weekly swing uses a trade through the prior week's high or low, not the close.
All readings on this track · 30 readings
- 1982Constructing range resistance from harmonic swing divisions
- 1984Gold swing chart: failed highs, wash-out, and a boxed pivot range
- 1988Remaining life on a percent-filtered swing chart
- 1991Ranking turning points with percentage swing filters
- 1991Five-count swing-chart construction and break rules
- 1992Constructing the Gann quarterly swing from the prior quarter's intraday range
- 1992Audit quarterly swing breakouts with a slower average cross
- 1992Weekly swing invalidation and the trailing stop
- 1992Quarterly swing chart construction and trend duration
- 1998A two-bar swing is unfinished until it names the stop
- 1999Multiple time-frame swing-channel trade setups
- 1999Separate two-bar swing direction from peak-valley trend
- 2000Constructing peak-trough swing reversals
- 2002Swing charts as shared grammar for trading mentorship
- 2002Confirming the last leg of a zigzag trend filter
- 2004When a late trend bends: test the pause before sizing a reversal
- 2006Crude oil swing counts and cycle clusters
- 2006When late rallies flatten: a swing-chart classroom
- 2006Relocating trading certainty to the decision process
- 2008Swing highs, bar-count pace, and the cost-price stop
- 2010Constructing suspect versus confirmed swing trends
- 2010Constructing swing charts from clear bar ranges
- 2010Building price force maps from two-bar swings
- 2010Clear-method swing-chart construction
- 2011Treat a squared-chart swing forecast as a same-day hypothesis
- 2012Cycle mode construction from aligned bandpass swing waves
- 2013Stacked swing lows and breakout retrace tests
- 2015Building swing charts from perceptually important points
- 2015Construct a zztop from perceptually important points
- 2016Isolating swings with percentage trend thresholds