2002issue C031-4
Constructing volatility stops from average true range and parabolic SAR
A stop-loss can be assembled from the instrument in front of you rather than from a round percentage. The workflow builds a three-case true-range object, smooths it into an average band, then keeps the loss limit either as a fixed offset outside that band or as a reverse overlay that starts far from the entry and tightens only after the position becomes profitable.
- True range is the largest of the session high-low span and the two distances from the prior close, so a gap that ordinary range would hide still enters the stop budget.
- Average true range is a volatility yardstick, not a buy or sell trigger, and it stays positive in both rising and falling markets.
- ATR position sizing sets stop distance and exposure from account equity plus the name's own range, so a quieter name and a wilder name do not share the same dollar leash.
- Once the average band exists, the loss limit is either a stop just outside the ATR channel or a parabolic reverse that starts distant and tightens as the trade moves in its favor.
The stop is a built part
A stop-loss is a preplanned exit placed to bound the loss if the thesis fails. In this construction it is located from volatility or a trailing reverse rather than from a generic percentage alone.
The historical workflow starts with the instrument in front of you. True range supplies a three-case range object. Average true range turns that object into a band that a later stop-loss can sit against.
Three distances make true range
True range is the largest of three distances: the current high minus the current low, the current high versus the prior close, or the current low versus the prior close.
A close-to-open gap can vanish from ordinary high-low range. A name that closed at 10 and then traded only from 12 to 12.50 would show a 0.5 session range even though the move from the prior close is 2.5. The three-case construction is what brings that gap into the range object.
Average true range is the band
A common initial average true range is built by combining the latest true range with the previous 13 ATR values and dividing by 14. The result is a smoothed reading over that lookback, used as a volatility yardstick rather than a buy or sell trigger.
Because true range is an absolute distance, ATR stays positive in both rising and falling markets. A rising ATR with a falling price can still describe an expanding downtrend. That split is range-price divergence: range does not carry a sign, so ATR can rise while price falls or fall while price holds high.
A low ATR region is read as a narrow, consolidating band. A high ATR region is read as a more active, trending regime. The raw dollar size of ATR is not comparable across price levels without scaling.
Ford 14-day average true range, May–November 2001
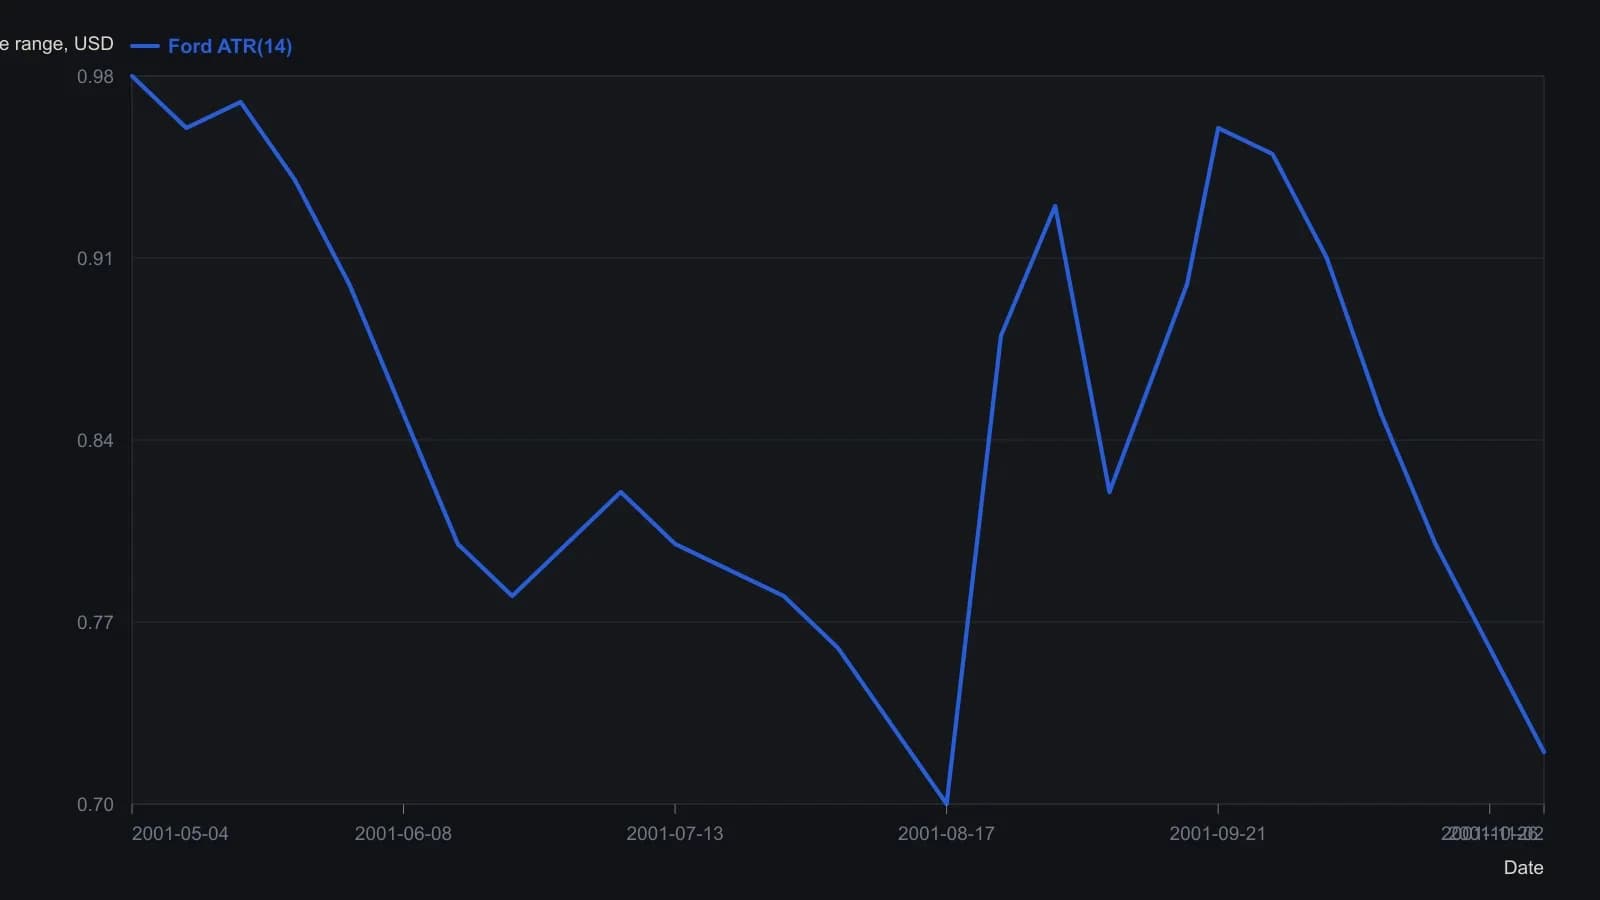
Read off the upper ATR(14) pane of the 2 November 2001 StockCharts daily. Printed ticks are 0.70, 0.80, 0.90 and 1.00; samples are weekly and only good to about three hundredths. The pane header quotes 0.60 on the last bar; the article describes the mid-August jump as 0.50 to almost 0.90 and the post-gap peak as 1.00.
Exposure follows the instrument
When two names trade at different prices and different ATR levels, the higher-volatility name is given more stop leeway. Scaling the quieter name's ATR toward the higher-priced name still left it below the wilder name's ATR in the illustrated pair.
ATR position sizing sets stop distance and allowable exposure from account equity plus the instrument's own ATR, so a quieter name and a wilder name do not share the same dollar leash.
A fixed channel stop or a reverse overlay
A simpler constructed stop sits just outside the current ATR channel. On one illustrated long from 25, a 5 percent stop landed at 23.75 while an ATR of 0.65 put the volatility stop at 24.35.
A parabolic stop-and-reverse overlay built from ATR starts with a distant initial stop and is recalculated so the stop tightens as the position becomes profitable.
In a sideways band the same reverse-stop construction can flip near opposite edges of the range. That is why it is used more as a daily trailing exit than as a standalone entry engine. Consolidation is the low-ATR stretch in which price stays inside a narrow band and that flip can appear.
All readings on this track · 21 readings
- 1987Constructing parabolic stops and cycle-window averages
- 1989Evaluating always-in parabolic SAR trailing stops
- 1993Constructing parabolic time-price trailing stops
- 1995Constructing parabolic SAR as an accelerating trail
- 1995Constructing a noise-buffered parabolic trailing stop
- 1997Constructing a parabolic trailing stop that only tightens
- 1998Triangle breakouts filtered by an exponential average and exited with parabolic stops
- 2000Treat volume-price imbalance as a hypothesis and let Parabolic SAR hold the exit
- 2002Constructing volatility stops from average true range and parabolic SAR
- 2002Parabolic SAR construction from stop outputs to reversal signals
- 2002Always-in-market SAR trail with directional confirmation
- 2004Forex trend confirmation with Average Directional Index, Parabolic SAR, and trendlines
- 2006Permission and fill gates for mechanical systems
- 2008A Relative Strength Index channel for profit lock and a trailing stop for capital protection
- 2010Building loss limits from the parabolic stop-and-reverse plot
- 2015Dual-zone currency indexes filter parabolic SAR signals
- 2016A parabolic trailing stop is not a complete system
- 2019Assigning jobs in a stochastic, parabolic, and moving-average stack
- 2019A three-filter stack as a redundancy test
- 2020Mechanical Parabolic SAR as an always-in flip after a breakout
- 2020Layering Relative Strength Index, MACD, and Parabolic SAR onto relative rotation maps