2001issue C061-6
Constructing an elastic volume-weighted average and volatility bands
Two chart objects can be constructed from the same bar: an elastic volume-weighted average that updates only while a fixed share budget remains, and a pair of 20-bar envelopes that share one center line and swap the width statistic.
- The elastic volume-weighted moving average is a recursive blend of the prior value and the current price, weighted by how much of a fixed share budget the bar's scaled volume consumes.
- If scaled bar volume exceeds the share budget, later values of the average are held flat until that budget constant is raised.
- Standard-deviation bands and average-true-range bands share a 20-period exponential average of the close and differ only by using two close standard deviations or two times a 20-period average true range as the half-width.
- A construction test can buy when the close is below a chosen lower band and flatten after a fixed five-bar holding period, with an exclusive-range entry that also requires the close to remain above the standard-deviation lower band.
Two chart objects can be constructed from the same bar. One is an elastic volume-weighted moving average that updates only while a fixed share budget remains. The other is a pair of 20-bar envelopes that keep one center line and swap the width statistic.
An elastic volume-weighted average
The elastic volume-weighted moving average is a recursive blend: the previous value times the remaining share budget, plus the current price times scaled bar volume, all divided by the fixed share budget. The share budget is a fixed total-share constant that both scales the update weight and, when exceeded, freezes further updates.
On the first bar the elastic average is seeded with the chosen price series, commonly the close or the median of high and low.
A volume divisor of one leaves reported volume unscaled. A larger divisor is used only to prevent overflow when share counts are large.
Two envelopes around one center line
Standard-deviation bands are a 20-period exponential average of the close plus and minus two close standard deviations over the same lookback.
Average-true-range bands keep that same 20-period center line and replace the width with two times a 20-period average true range.
A close-to-band construction test
A construction test can buy when the close is below a chosen lower band and flatten after a fixed five-bar holding period. That exit is a fixed-horizon exit: it follows a preset number of bars rather than a price target or a reverse-band signal.
An exclusive-range entry requires the close below the average-true-range lower band and still above the standard-deviation lower band before entry.
Bounding exposure before entry
Position size can be fixed in contract-dollar terms before entry so exposure is bounded independently of the band or average formula. ATR position sizing sizes a position from account equity, volatility, and a bounded contract or dollar exposure before the order is placed.
Eastman Kodak daily close versus 20-bar volatility envelopes
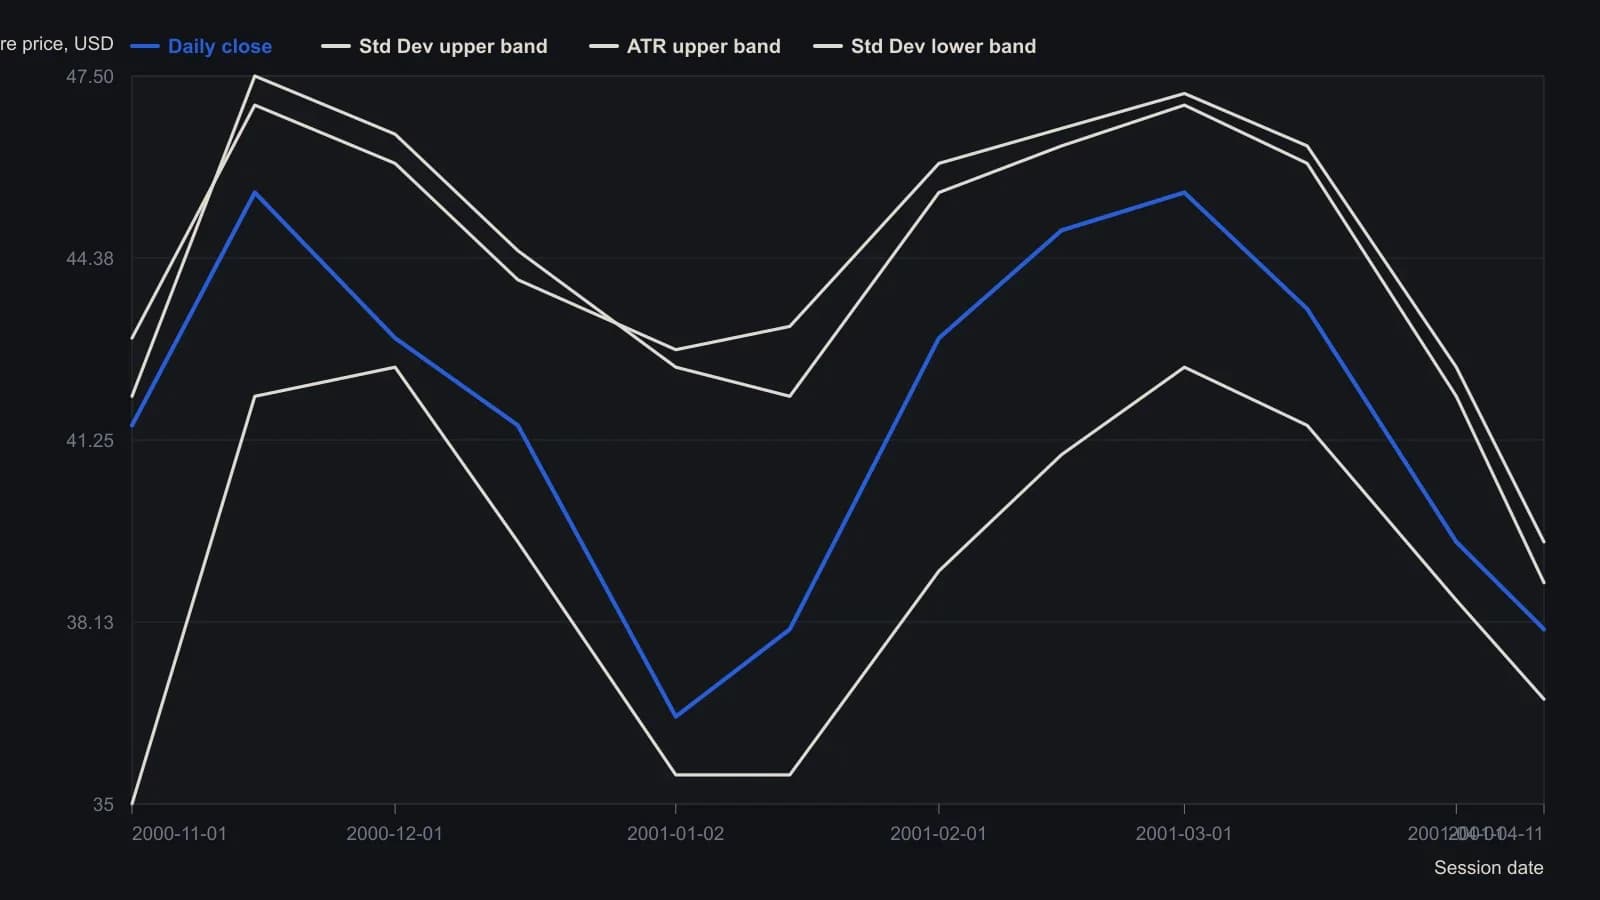
Both envelopes follow the issue's 20-bar center and a width of twice the 20-bar statistic. The printed outside-close counts cover all 2,555 bars, not only the November 2000–April 2001 window.
All readings on this track · 18 readings
- 2000Volume-weighted average price as a baseline for indicator construction
- 2001Constructing VWAP support and resistance from cumulative volume
- 2001An elastic volume-weighted moving average from a share-count lookback
- 2001Constructing an elastic volume-weighted average and volatility bands
- 2004Volume-weighted column averages and crossovers on point-and-figure charts
- 2004Session volume-weighted average for limit placement and listed routing
- 2008Building MIDAS curves from an anchored volume-weighted average
- 2008Construct a launch-point VWAP as support and resistance filters
- 2014Workstation order routing, VWAP, and session filters
- 2015Constructing price gravity and float turnover filters
- 2015Constructing four-stage cycles with anchored VWAP
- 2017Constructing a volume-weighted crossover and breakout as one swing rule set
- 2017Constructing a volume-weighted moving-average crossover
- 2017Constructing anchored volume-weighted average price maps for crowd-visible execution costs
- 2018Order book heatmaps, VWAP, and flow for execution
- 2018Constructing futures rolls ahead of first notice day
- 2019Evaluate a mechanical futures system as one procedure
- 2020Every bounce is a falsifiable regime test