2002issue C031-2
Swing charts as shared grammar for trading mentorship
A 2002 trading-education desk ran live voice-and-text sessions, published free commentary on major averages and a semiconductor index, and kept newsletters on the site. Proprietary swing charts were the technical foundation for that shared review.
- Live voice-and-text sessions let students watch the same market discussion as prices updated.
- Swing charts were the technical foundation, with the average directional index and exponential moving averages as preferred companions.
- Site-kept newsletters and recurring commentary let readers reconstruct how the desk framed a long after a notable market low.
- Paid tiers bundled swing-chart software and a weekly live review, and a product goal was to pair those charts with a robust data feed on widely used platforms.
Watching the same discussion as prices updated
A 2002 trading-education desk ran live voice-and-text sessions so students could watch the same market discussion as prices updated. That live-market-review was a scheduled voice-or-text walkthrough of the same charts while prices were updating, so a hypothesis could be watched as it formed.
Free market-commentary went out at least three times a week and described recent movement in major averages and a semiconductor index. The briefings showed how the desk read day-to-day structure before a student took a paid seat.
Newsletters were kept on the site so readers could reconstruct how the desk framed a long after a notable market low.
Swing charts as the shared technical foundation
Proprietary swing charts were presented as the technical foundation. A swing-chart collapses raw bars into directional swings so teacher and student can name the same structure and turn it into a testable trade hypothesis.
The average directional index was named as a preferred companion: a trend-strength reading used with swing structure, not as a stand-alone entry rule. Exponential moving averages were the other named companion, kept beside the swing chart as a recent-weighted supporting overlay.
$INDU daily swings into a failed January 2002 breakout
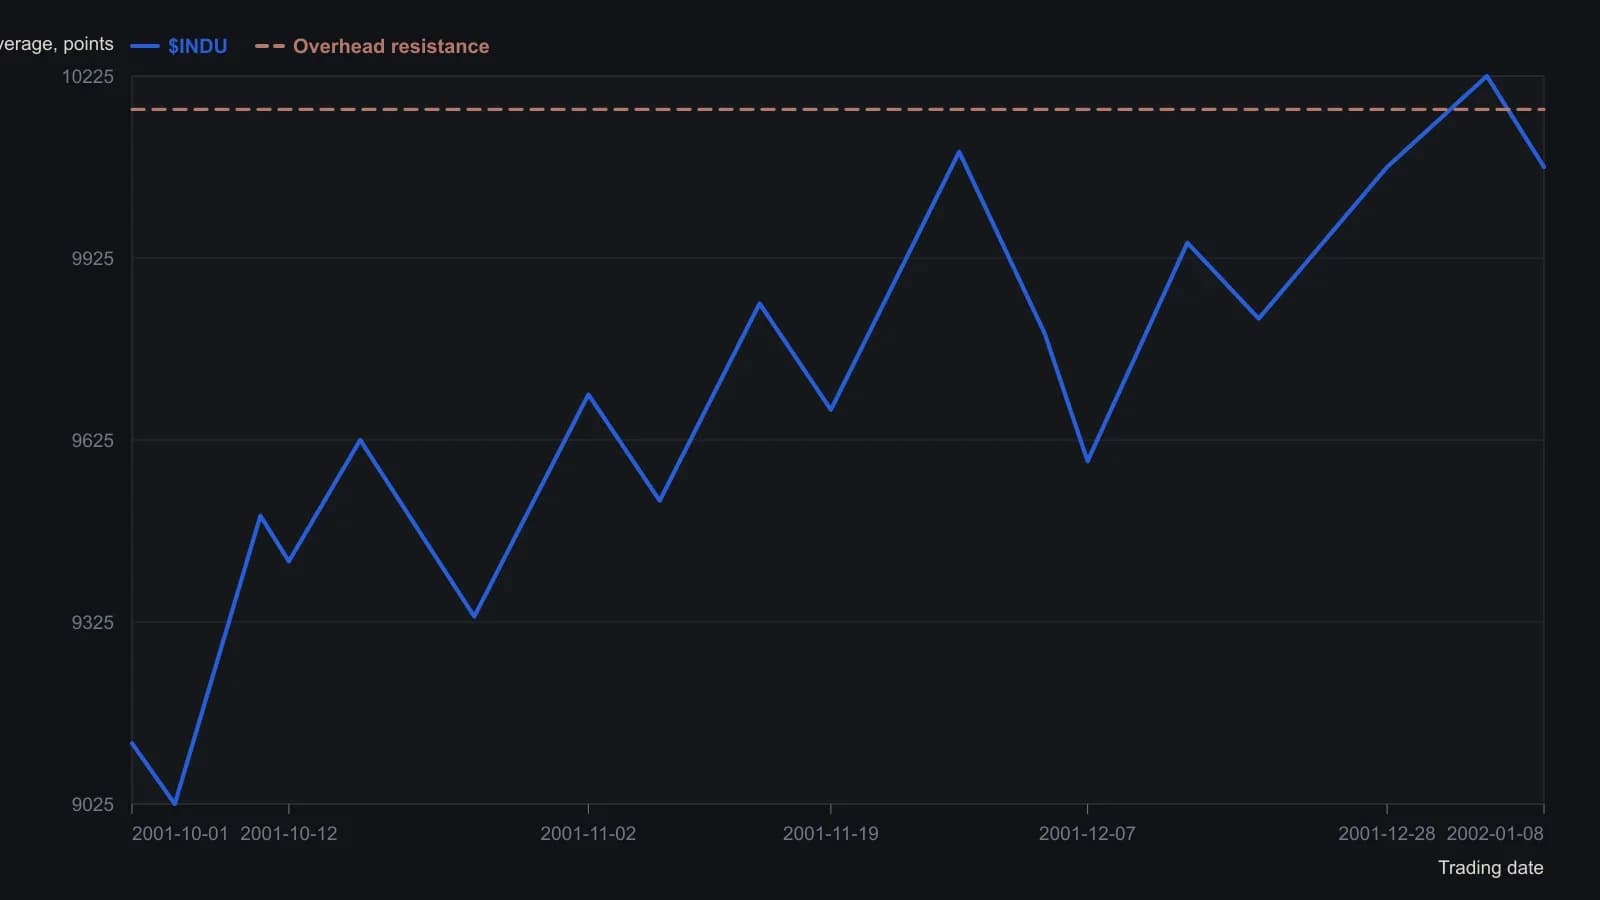
Intermediate session dates are inferred from the Oct–Jan month marks, not from a session log. Axis labels sit 256 points apart; prices are approximate to about 50 index points.
How the paid packages were built
One paid tier bundled swing-chart software for both PC and Macintosh, a fuller newsletter, and a weekly two-hour live review of the week just past and the week ahead.
The mid-tier package was framed around longer-horizon market survival. The higher-cost package added a technical handbook, a live forum, and more discrete setups.
A 2002 product goal was to pair those swing charts with a robust data feed and to expose the swing-chart indicator on widely used charting platforms.
All readings on this track · 30 readings
- 1982Constructing range resistance from harmonic swing divisions
- 1984Gold swing chart: failed highs, wash-out, and a boxed pivot range
- 1988Remaining life on a percent-filtered swing chart
- 1991Ranking turning points with percentage swing filters
- 1991Five-count swing-chart construction and break rules
- 1992Constructing the Gann quarterly swing from the prior quarter's intraday range
- 1992Audit quarterly swing breakouts with a slower average cross
- 1992Weekly swing invalidation and the trailing stop
- 1992Quarterly swing chart construction and trend duration
- 1998A two-bar swing is unfinished until it names the stop
- 1999Multiple time-frame swing-channel trade setups
- 1999Separate two-bar swing direction from peak-valley trend
- 2000Constructing peak-trough swing reversals
- 2002Swing charts as shared grammar for trading mentorship
- 2002Confirming the last leg of a zigzag trend filter
- 2004When a late trend bends: test the pause before sizing a reversal
- 2006Crude oil swing counts and cycle clusters
- 2006When late rallies flatten: a swing-chart classroom
- 2006Relocating trading certainty to the decision process
- 2008Swing highs, bar-count pace, and the cost-price stop
- 2010Constructing suspect versus confirmed swing trends
- 2010Constructing swing charts from clear bar ranges
- 2010Building price force maps from two-bar swings
- 2010Clear-method swing-chart construction
- 2011Treat a squared-chart swing forecast as a same-day hypothesis
- 2012Cycle mode construction from aligned bandpass swing waves
- 2013Stacked swing lows and breakout retrace tests
- 2015Building swing charts from perceptually important points
- 2015Construct a zztop from perceptually important points
- 2016Isolating swings with percentage trend thresholds