1999issue C101-6
Evaluating a long-only breakout system with a volatility stop
A long-only Breakout system can be evaluated as one procedure when the entry is a weekly breakout and the exit is a Volatility stop, so the loss bound scales with recent range rather than a fixed price offset.
- A long Volatility stop is the entry-bar close minus a chosen multiple of a four-bar average true range, so the exit distance follows recent range.
- After it is set, the long stop may rise or hold sideways but is not allowed to fall unless the bar low penetrates it.
- The evaluated Breakout system enters on a stop at the current week high plus one tick only when that week close is above a 12-week exponential moving average, then exits on the Volatility stop.
- The same four-period construction can be used in other time frames, but stop width is sensitive to the traded series.
What the archive evaluates
The archive evaluates a complete long-only procedure rather than an isolated entry rule. A Breakout system places the entry, and a Volatility stop sets the exit so that the distance from price to the stop follows recent range.
How the Volatility stop is formed
A long Volatility stop is formed from the entry bar close minus a chosen multiple of a four-bar average true range. The exit distance therefore scales with recent range rather than a fixed price offset.
True range is the greatest of the current bar high-low, the current high versus the prior close, or the current low versus the prior close. Overnight gaps are counted in the volatility measure used by the stop.
The stop is not allowed to loosen
Once a long Volatility stop is set, it is allowed to rise or hold sideways but not to fall unless the bar low penetrates it. That construction keeps the loss bound from loosening after entry.
The long-only breakout procedure
The evaluated long-only procedure enters on a stop at the current week high plus one tick only when that week close is above a 12-week exponential moving average of closes. It then exits on the Volatility stop.
Other time frames and the short side
The same four-week lookback and sell-stop construction can be applied in other time frames. A short-side buy-stop would sit a multiple of average true range above the close and must not rise unless the prior bar high penetrates it.
Stop width depends on the series
On the tested home-finance sector series, a 3.5 to 4.0 average-true-range multiplier sat at a local peak while the 2 to 3 multiplier band remained profitable. The archive result shows that stop width is sensitive to the traded series.
Best Buy weekly price and trailing volatility stop, 1996–1997
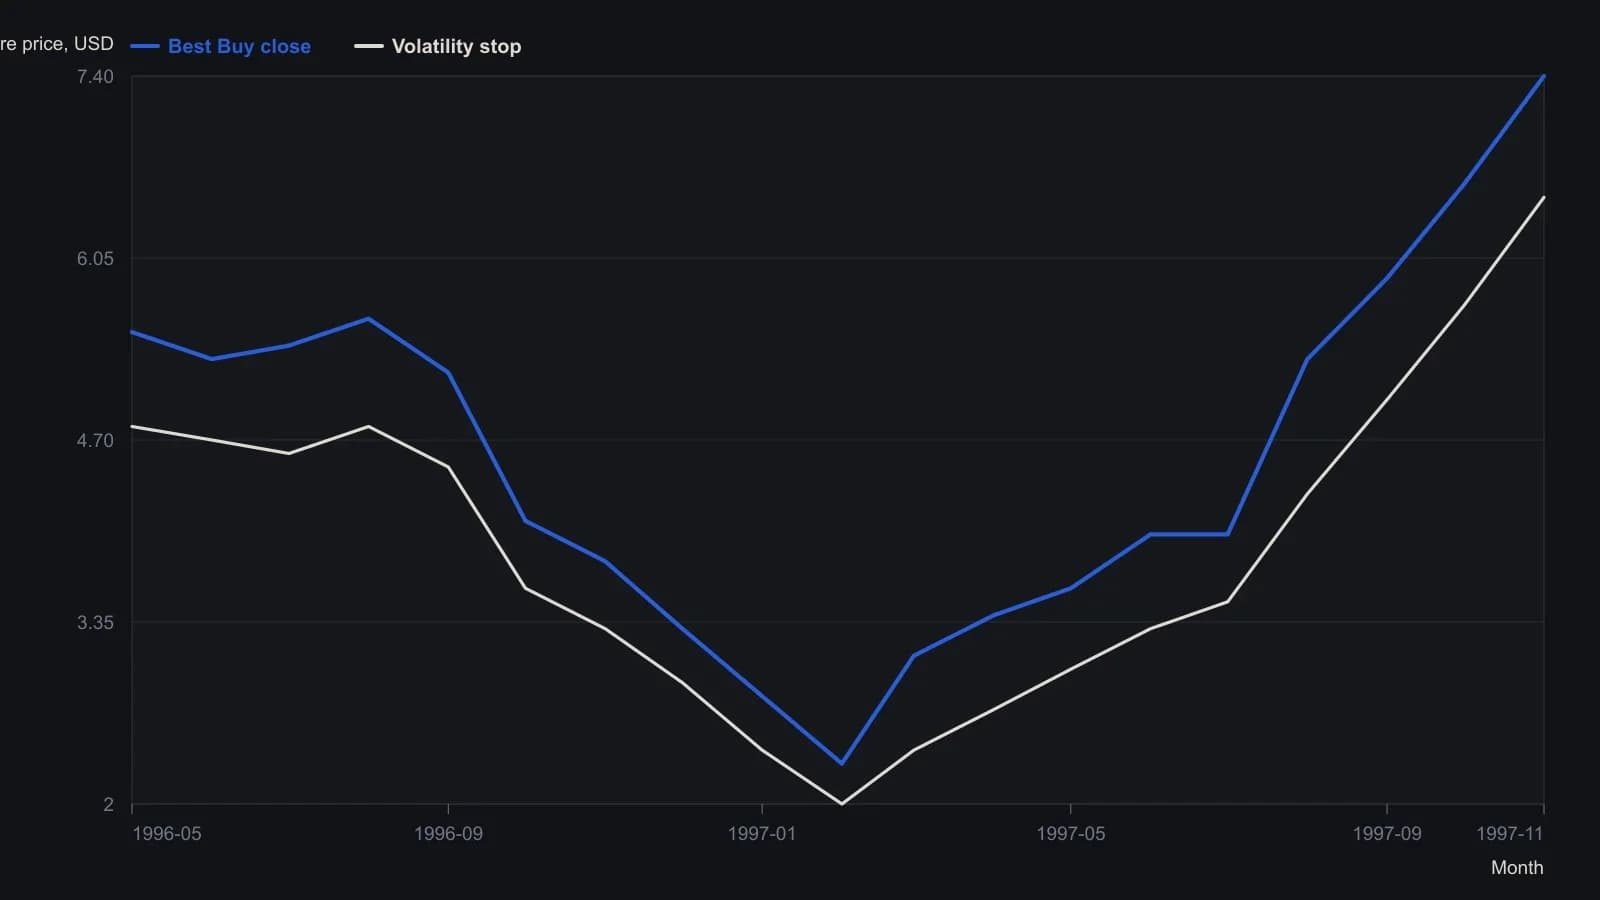
Vakkur used a four-week average true range and would not let the long sell-stop ease unless the weekly low took it out. The visible pane is May 1996–November 1997; his tabulated Best Buy test ran January 1990–November 1998. Prices are approximate to about $0.10–0.20 because they were read from a coarse screenshot.
All readings on this track · 12 readings
- 1989A close-only volatility reverse bound to average true range
- 1992Equity-curve average as a live-capital gate
- 1992Constructing volatility-adaptive trailing stops
- 1993Constructing skew-adjusted volatility stops and pyramid size
- 1999Evaluating a long-only breakout system with a volatility stop
- 1999When markets burst, not trend
- 2005Building entry rules with ratchet volatility stops
- 2005Pricing entries, stops and exits in range units
- 2013Constructing asymmetric volatility bands for reversal, trend, and stops
- 2015Mark the stop, the target, and the invalidation line before entry
- 2019Bounding capital risk with phase-aware stops
- 2019Measure the Bollinger Bands touch before adding engulfing and a volatility stop