1989issue C071-4
A close-only volatility reverse bound to average true range
This archive construction keeps a trend-following book always positioned and reverses only on the close. Average true range times a constant factor sets how far that reverse sits from the extreme favorable close, so the allowed distance expands and contracts with market speed.
- Stay always positioned in a trend-following book and reverse only on a close-only stop that trails the extreme favorable close of the open trade.
- Measure volatility as average true range. The reverse sits the average-range constant away, which is that average times a constant factor.
- Raise the constant factor to place the reverse farther from price and flip less often. The trail widens when ranges expand and tightens when they contract.
- A close-only rule can let a large adverse move print during the session before the stop can act, especially in markets without daily limits.
An always-positioned trend-following reverse
The construction is an always-positioned trend-following procedure. It stays long or short and reverses with a close-only stop that trails the extreme favorable close of the open trade.
Entry, reverse, and the decision to remain in the market are one rule set. The reverse is a volatility-stop: it may fire only on the close, and its distance from the most favorable close of the trade expands or contracts with measured volatility.
Average true range as the speed input
Volatility is measured as average true range over n days. True range is the greatest of the session high-low span, the session high versus the prior close, or the session low versus the prior close.
After the first n-day average, later average true range values can be updated as the prior average times n minus one, plus today's true range, divided by n. A 10-day example multiplies the prior average by nine, adds today's true range, and divides by 10.
The same volatility input loosens the trail when ranges expand and tightens it when ranges contract. Stop distance therefore changes in proportion to average true range.
Constant factor and the average-range constant
Stop distance equals average true range multiplied by a constant factor. A larger factor places the reverse farther from price and produces fewer flips.
Exit and reverse are defined at the average-range constant, which is average true range times the constant factor, measured from the extreme favorable close.
In the supplied construction example, a 200-point average range and a 3.5 factor put a long close-only stop 700 points below the highest close of that trade.
What the construction search varied
The construction search examined volatility lookbacks from 6 to 20 days and constant factors from 1.0 to 4.0.
Editorial note: the archive records that range as the historical workflow. The facts allowed here do not say which pair was chosen or how any pair behaved.
Closed profit and peak drawdown after the volatility-system search
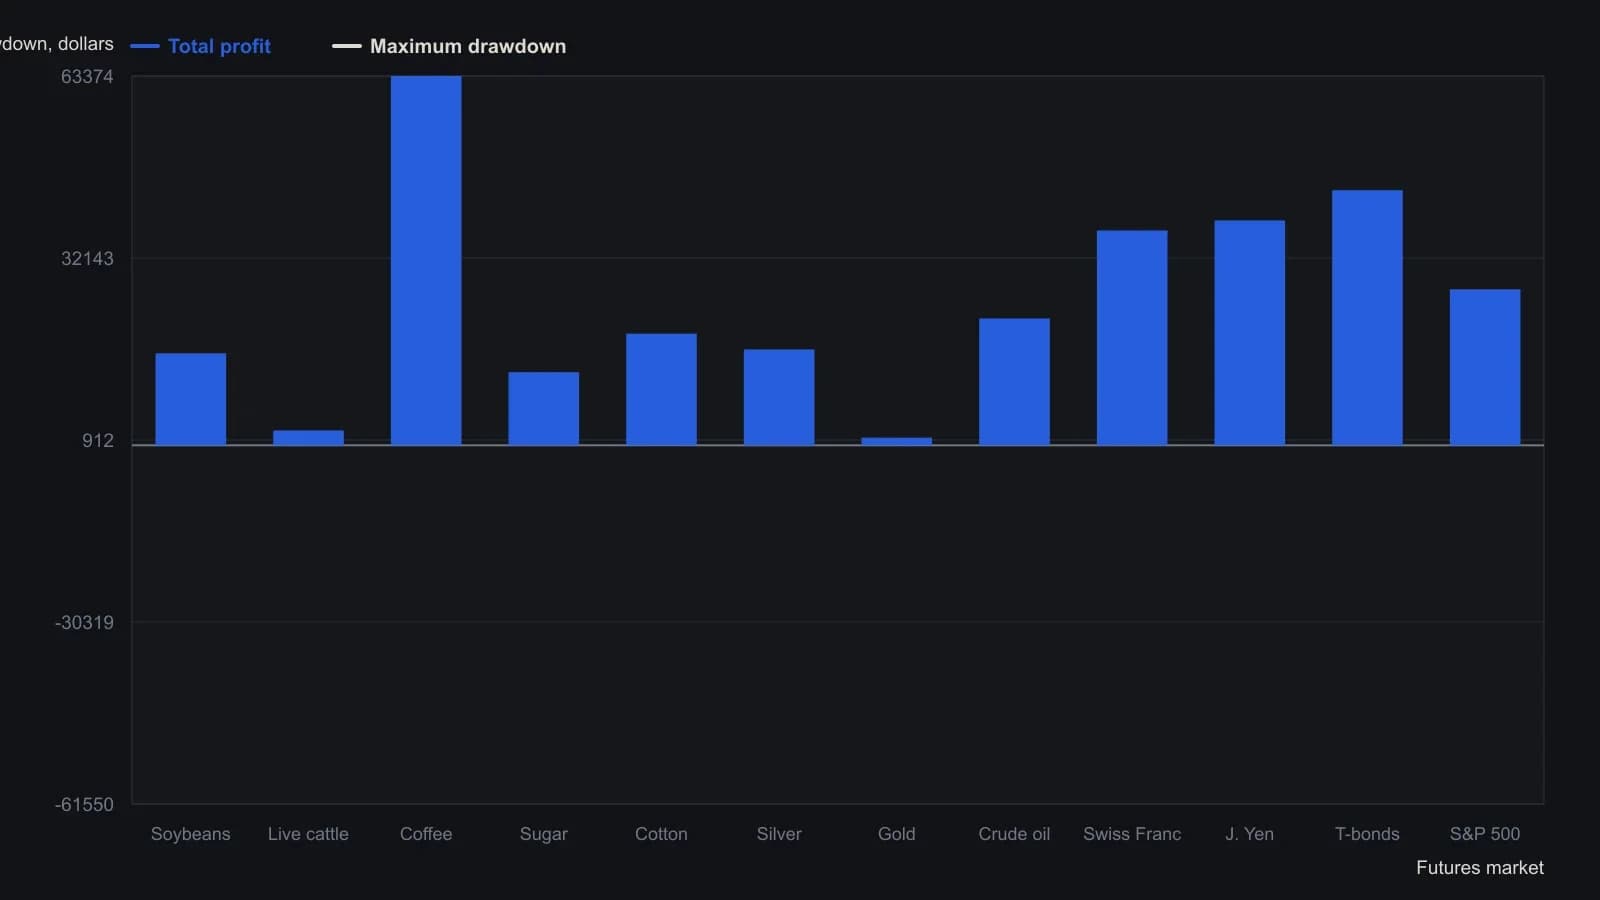
Aan subtracted $100 from every trade for slippage and commission. The day count and constant factor he lists for each market sit inside the search he ran: 6–20 days for average true range and 1.0–4.0 for the multiplier. Sample windows differ slightly by contract, mostly mid-1983 through mid-1988.
All readings on this track · 12 readings
- 1989A close-only volatility reverse bound to average true range
- 1992Equity-curve average as a live-capital gate
- 1992Constructing volatility-adaptive trailing stops
- 1993Constructing skew-adjusted volatility stops and pyramid size
- 1999Evaluating a long-only breakout system with a volatility stop
- 1999When markets burst, not trend
- 2005Building entry rules with ratchet volatility stops
- 2005Pricing entries, stops and exits in range units
- 2013Constructing asymmetric volatility bands for reversal, trend, and stops
- 2015Mark the stop, the target, and the invalidation line before entry
- 2019Bounding capital risk with phase-aware stops
- 2019Measure the Bollinger Bands touch before adding engulfing and a volatility stop