2006issue C121-4
Relocating trading certainty to the decision process
Markets are described as remaining uncertain in both ranges and trends, so a written trading plan is the starting reference for decisions. This case study follows that plan from a swing-chart read of structure through a trend-following participation rule and a pre-trade checklist that treats entry, exit, and standing aside as one procedure.
- Markets remain uncertain in both ranges and trends, so a written trading plan is the starting reference for decisions.
- The illustrated plan reads successive turns on a swing chart, shown by recasting a 2005 daily crude-oil series as a two-day swing chart that strips short-term noise.
- A visible trend is incomplete without predefined entry reasons, exit reasons, and risk limits, tested with the trend rules as one procedure.
- Market direction is treated as unknowable in advance. Remaining certainty sits in a plan that already specifies the response on every path price can take.
Uncertainty stays in the market
Markets are described as remaining uncertain in both ranges and trends. A written trading plan is offered as the starting reference for decisions. That written procedure is the trading-plan-anchor: it supplies a stable decision reference when market outcomes remain uncertain.
The plan does not claim to know the next path of price. Remaining certainty is located in a procedure that already specifies the response no matter which path price takes.
A swing chart of successive turns
The illustrated plan is organized around a swing chart that reads successive turns in price structure. A daily crude-oil bar chart from calendar year 2005 is used to show raw price swings before any swing-chart filter is applied. The same crude-oil series is recast as a two-day swing chart to strip short-term noise and make the prevailing directional sentiment easier to see.
A swing-chart is a noise-filtered reading of OHLC swing structure used to turn a repeatable chart condition into a directional hypothesis from intraday to multi-week horizons. Swing-chart reading is presented as applicable from intraday positioning through daily, weekly, and monthly horizons.
Crude oil 2-day swing turns, 2005
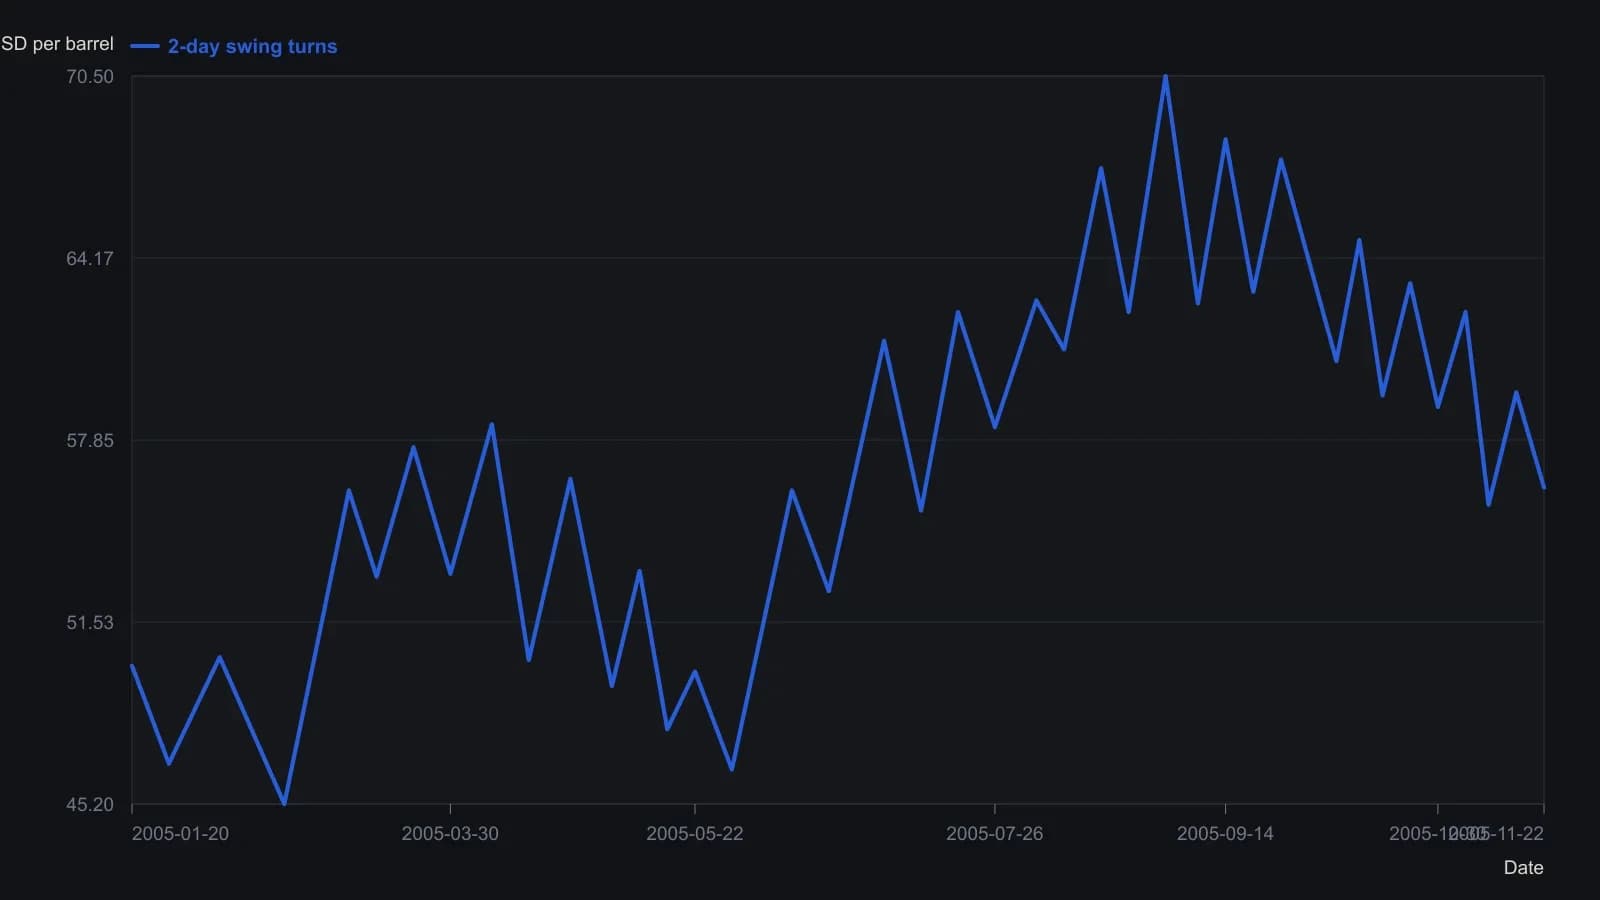
Prices are approximate to about 0.3 USD against the 1.00 grid. Calendar dates for each turn are placed from monthly axis ticks. The figure’s last-price marker reads 52.107, below the final visible swing.
Trend following still needs a written response
Seeing a trend is treated as incomplete without predefined reasons to enter and exit and without risk-management rules inside the same plan. Trend-following in this workflow is a rule set that seeks participation only in established directional swings and treats entry, exit, and standing aside as one procedure.
Expanding swings in the trend direction and contracting swings against it are offered as a price-only check that momentum is building. That check is swing-range-momentum: a comparison of successive swing lengths with and against the prevailing direction, used to judge whether a move is strengthening.
Test the plan as one procedure
A checklist-process is a pre-trade sequence that requires defined entry reasons, exit reasons, and risk limits before a swing-chart signal is acted on. The combined trend, entry, exit, and risk rules are to be tested as one procedure before they are treated as a usable system.
Market direction is treated as unknowable in advance. The remaining certainty is the trading-plan-anchor that already specifies how to enter, how to exit, and when to stand aside.
All readings on this track · 30 readings
- 1982Constructing range resistance from harmonic swing divisions
- 1984Gold swing chart: failed highs, wash-out, and a boxed pivot range
- 1988Remaining life on a percent-filtered swing chart
- 1991Ranking turning points with percentage swing filters
- 1991Five-count swing-chart construction and break rules
- 1992Constructing the Gann quarterly swing from the prior quarter's intraday range
- 1992Audit quarterly swing breakouts with a slower average cross
- 1992Weekly swing invalidation and the trailing stop
- 1992Quarterly swing chart construction and trend duration
- 1998A two-bar swing is unfinished until it names the stop
- 1999Multiple time-frame swing-channel trade setups
- 1999Separate two-bar swing direction from peak-valley trend
- 2000Constructing peak-trough swing reversals
- 2002Swing charts as shared grammar for trading mentorship
- 2002Confirming the last leg of a zigzag trend filter
- 2004When a late trend bends: test the pause before sizing a reversal
- 2006Crude oil swing counts and cycle clusters
- 2006When late rallies flatten: a swing-chart classroom
- 2006Relocating trading certainty to the decision process
- 2008Swing highs, bar-count pace, and the cost-price stop
- 2010Constructing suspect versus confirmed swing trends
- 2010Constructing swing charts from clear bar ranges
- 2010Building price force maps from two-bar swings
- 2010Clear-method swing-chart construction
- 2011Treat a squared-chart swing forecast as a same-day hypothesis
- 2012Cycle mode construction from aligned bandpass swing waves
- 2013Stacked swing lows and breakout retrace tests
- 2015Building swing charts from perceptually important points
- 2015Construct a zztop from perceptually important points
- 2016Isolating swings with percentage trend thresholds