1993issue C101-10
Constructing skew-adjusted volatility stops and pyramid size
This archive workflow measures true closing range, then sets stop distance from the spread of that range and a right-tail cushion. Three bands map to how much size is held or cut, and tick-chart adds trail the stop to the prior add.
- True closing range is the largest of high minus low, high minus prior close, or low minus prior close, stated in the market's own price units.
- A fixed multiple of average true range still cannot widen or tighten when reversal risk changes, even though two series can share a mean true closing range of 90 points and differ when one maximum bar is 126 points and the other is 102.
- After a skew correction, three deviation bands are estimated at about 15 percent, 2 percent, and near-zero chance of a hit during a two-bar reversal, and size is cut as the stop is moved out.
- On tick charts, size is added only after a new extreme, then the stop is trailed to the prior add so each increment has a stated invalidation.
Measure bar-to-bar volatility as true closing range
Bar-to-bar volatility is measured as true closing range: the largest of high minus low, high minus prior close, or low minus prior close, expressed in the market's own price units.
A volatility stop takes its distance from that measured bar range, from range variance (how far individual true-closing-range values sit from their mean), and from a right-tail cushion, rather than from a fixed tick count.
A single average-range multiple cannot follow reversal risk
A stop set to average true range times a fixed multiple expands and contracts with activity, but one multiplier still cannot widen or tighten when reversal risk changes.
Two series can share a mean true closing range of 90 points and still differ in practical risk when one maximum bar is 126 points and the other is 102.
Wheat true-closing-range distribution
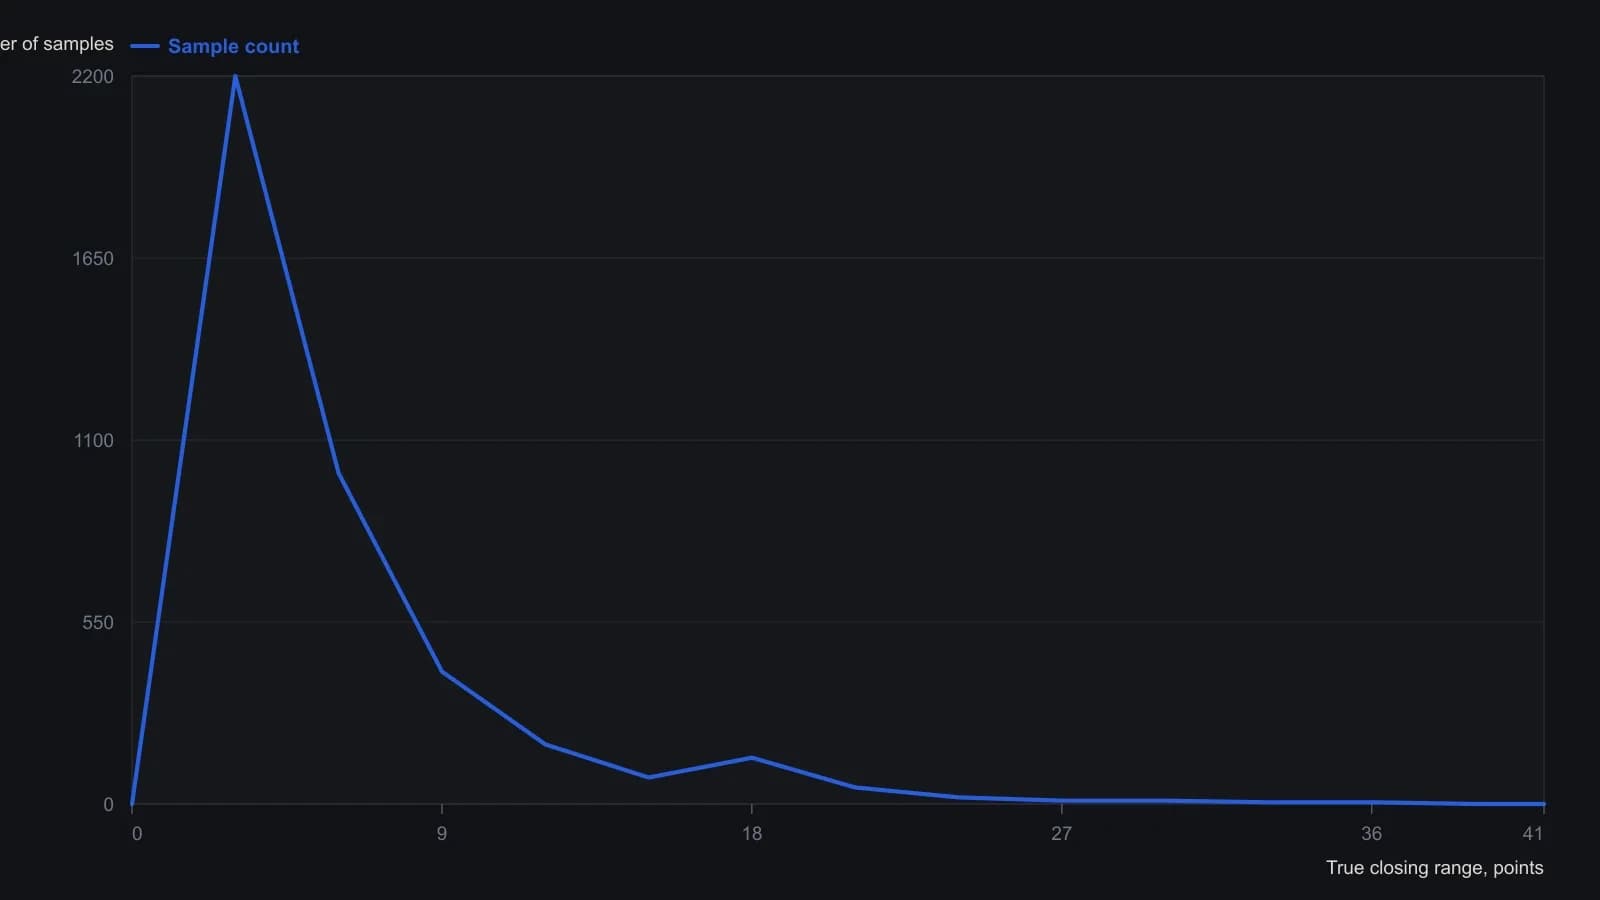
Digitized from a 3-D histogram. Counts above 200 are rounded to the nearest 50; values after 24 sit on the floor and are only a rough read.
Read a deviation stop as a next-bar hit chance
A stop placed a stated number of standard deviations beyond mean true closing range can be read as a next-bar hit probability. 1.282 standard deviations beyond the mean corresponds to a 90 percent chance the next bar does not hit.
Observed true-closing-range tails run from 45 percent higher to twice a normal-curve prediction, so a two-standard-deviation stop is given an extra 6 to 25 percent cushion and a three-standard-deviation stop an extra 20 to 50 percent. That fat right tail is volatility skew: the largest bars exceed what a symmetric distribution with the same mean would imply.
Three deviation bands and the size cuts
A skew correction averaged over a thousand samples of 100 consecutive bars is applied to double-bar mean range and its standard deviation to produce three stop distances. Those deviation bands are estimated at about 15 percent, 2 percent, and near-zero chance of a hit during a two-bar reversal.
The narrow band is used early or when a reversal warning appears, the middle band is used to reduce size during a possible reversal, and the wide band is the default holding stop. ATR position sizing ties how much size is held, cut, or kept to account exposure and to the chosen volatility-stop distance. Size may be cut one-third then two-thirds, or half and half, at the middle and wide bands.
Adds on tick charts
On tick charts the construction uses a single 4.5-standard-deviation stop advanced only when a new high or low prints. Later adds trail that stop to the prior add so exposure grows only while the trail remains intact.
That add rule is pyramiding: size is added only after a new extreme, then the stop is trailed to the prior add so each increment has a stated invalidation.
All readings on this track · 12 readings
- 1989A close-only volatility reverse bound to average true range
- 1992Equity-curve average as a live-capital gate
- 1992Constructing volatility-adaptive trailing stops
- 1993Constructing skew-adjusted volatility stops and pyramid size
- 1999Evaluating a long-only breakout system with a volatility stop
- 1999When markets burst, not trend
- 2005Building entry rules with ratchet volatility stops
- 2005Pricing entries, stops and exits in range units
- 2013Constructing asymmetric volatility bands for reversal, trend, and stops
- 2015Mark the stop, the target, and the invalidation line before entry
- 2019Bounding capital risk with phase-aware stops
- 2019Measure the Bollinger Bands touch before adding engulfing and a volatility stop