2003issue C131-4
Reading cyclical bottoms inside secular bear regimes
An October 2002 rebound after declines from March 2002 and March 2000 is a case for classifying a move as a cyclical bear inside a secular bear before treating a double bottom, a failed test, or a late-year bounce as proof that the larger regime has turned.
- Classify a decline as a cyclical bear inside a secular bear before treating a double bottom, a failed test, or a late-year bounce as a secular-regime turn.
- During the 1966-1982 secular bear, several cyclical bottoms printed a failed test under the first low and still ended with an advance.
- Advance speed and seasonal windows showed up in unfinished bear-market rallies as well as at genuine cyclical endings.
- Bottom confirmation, such as reclaiming the rally high after the first cyclical low, is not a call that the secular bear has ended.
The 2002 rebound and the regime question
An October 2002 equity rebound began from an October 10 low and included a 130-point, 17% advance in the S&P 500. That bounce followed a decline already underway from March 2002 and, more broadly, from March 2000.
In TradersWeek editorial terms, the rebound is a prompt to classify the decline first. A double bottom, a failed test, or a late-year bounce can sit inside a cyclical bear that has not ended the secular bear around it.
How cyclical declines differ by secular regime
Cyclical declines that interrupt secular bulls, illustrated with 1987 and 1991, can be sharp or stagnant. Cyclical declines inside secular bears are described as broader, longer-lasting, and more destructive before they resolve.
A cyclical bear is a shorter decline that can reverse without ending the longer bull or bear regime that contains it. A secular bear is a multi-year down or sideways regime built from repeated cyclical advances and declines rather than a single final low.
Double bottoms and failed tests
A double-bottom structure is presented as a recurring feature of cyclical declines during the 1966-1982 secular bear, including the 1962, 1966-67, 1970, 1974-75, and 1981-82 episodes. The two-trough pattern is a bottoming hypothesis, not automatic proof that a decline is finished.
In several of those historical bottoms the first extreme low was followed by a still lower low that would count as a failed test. After that undercut, the cyclical decline still ended with an advance. A failed test can still precede a cyclical reversal.
Mid-regime washout and late-regime decline
The 1973-74 cyclical decline, described as the most severe of the 1966-1982 sequence, took the S&P 500 from about 120 early in 1973 to 62 in October 1974.
The 1981-82 decline was a smaller, roughly 26% equity drop near the end of that secular bear, set against long Treasury yields of 15% or higher and a deep recession. It is presented as unlike the mid-regime 1973-74 washout.
Seasonal windows and fast lifts
Calendar clustering of those cyclical lows is placed in the fourth quarter of 1962, the first quarter of 1967, and the fourth quarter of 1970. The later advances were still less than halfway to their subsequent peaks when those windows opened. A seasonal window is used only as context.
Fast lifts from the low appeared both in unfinished bear-market rallies and at genuine cyclical endings. Advance speed alone is not treated as a regime-change test, because a bear-market rally can look similar in speed to a genuine cyclical turn.
Calling the low and confirming it
Identifying the low before it prints is described as exceptionally difficult even with chart patterns, Fibonacci retracements, 30-week moving averages, and Elliott wave counts. Bottom-seeking often misreads consolidations as reversals.
A later move above the prior rally high after the first cyclical low is treated as bottom confirmation that a cyclical bottom is in place. That confirmation is not the same judgment as calling a secular-regime low.
S&P 500 weekly path through the 1966–67 cyclical bear
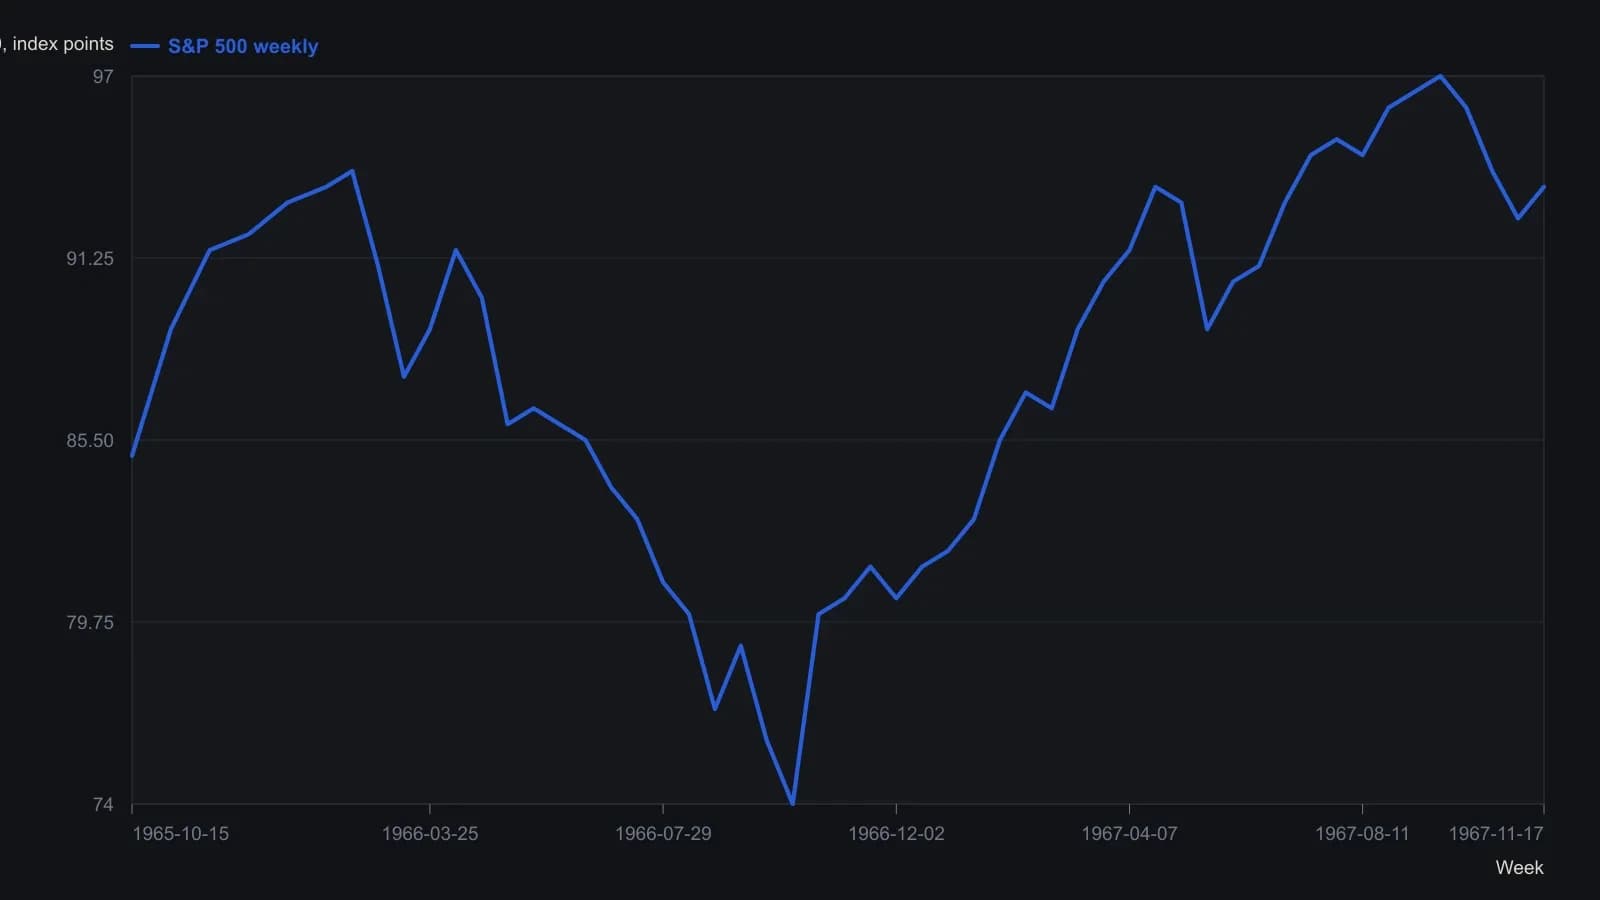
Weekly closes digitized from the candlestick raster at two-to-three-week steps; y-values are approximate to about one index point. The 108 print of late 1968 lies outside this window and is not plotted.
All readings on this track · 32 readings
- 1988Reaction length as a trend integrity test
- 1991Sold-out double bottoms as a three-gate inventory test
- 1991A breadth classifier for V-bottoms and W-bottoms
- 1991Precomputed price-ratio clusters and double-top tests
- 1992Bond turning points as a regime check on equity double tops and breakouts
- 1992Commodity-bond ratio as an equity regime overlay
- 1992Gold lead confirmation for commodity-index turns
- 1994Constructing the thousand-line advance-decline indicator
- 1995Evaluating zero-line patterns on a breadth-price oscillator
- 1996Constructing double tops from a resistance retest to a trough break
- 1996Four-stage double-bottom construction
- 1998Double-bottom confirmation and stop placement
- 2000Two-bar reversal construction
- 2001Constructing double tops from failed resistance retests
- 2002Eve-Eve double bottoms: width, confirmation, and overhead resistance
- 2002Constructing Eve-and-Eve and classic double bottoms
- 2003Eve-Adam double bottoms as a two-step classroom test
- 2003Shape contrast then breakout confirmation in Adam and Eve double bottoms
- 2003Reading cyclical bottoms inside secular bear regimes
- 2004A case study of the shark-attack Fibonacci retracement
- 2004Confirming index turns with envelopes, divergence, and breadth
- 2005A five-wave euro/dollar case and the support that still had to fail
- 2007Constructing commodity seasonal indexes for regime context
- 2009Constructing rounded and double-top short setups
- 2010Hourly pattern entries, exits, and abstention as one playbook
- 2016Ugly double bottom after a yearly low
- 2016An unconfirmed stock double bottom next to a confirmed index
- 2016Constructing a range-midpoint moving average
- 2017Evaluating whole-dollar delays on pattern breakouts
- 2018Volume-confirmed bottoms and breakouts with moving averages
- 2018Evaluating double bottoms with a locked stochastic confirmation
- 2019Forex pairs as relative value: yield spreads, support, and a double bottom