2003issue C021-3
Shape contrast then breakout confirmation in Adam and Eve double bottoms
An Adam and Eve double bottom pairs a pointed first trough with a wider second trough inside a downtrend. The intervening rally must already be on the chart, and only a close through the highest high between the lows turns the sketch into a testable breakout idea.
- Class the pair as Adam then Eve only when the first low is narrow and pointed, the second is wider, rounded, or flat, and the two shapes look distinctly unlike each other.
- Keep the sketch in a downtrend with lows several weeks apart, an intervening rally of at least 10 percent, and bottoms that sit close in price.
- Treat unconfirmed twin lows as incomplete. The primary test is a close above the highest high between the two bottoms.
- Use nearby resistance and the height-added measure rule to bound or veto the idea, and drop it if nearby support breaks or price falls through the lower bottom.
A two-trough sketch, not a finished call
An Adam and Eve double bottom is a two-trough reversal sketch inside a downtrend. The first low is an Adam bottom: a narrow, pointed trough, often marked by a sharp one-session downward spike. The second is an Eve bottom: a wider, more rounded or flat trough that may contain several minor lows. The two shapes do not look alike.
Claire's Stores Adam and Eve double bottom
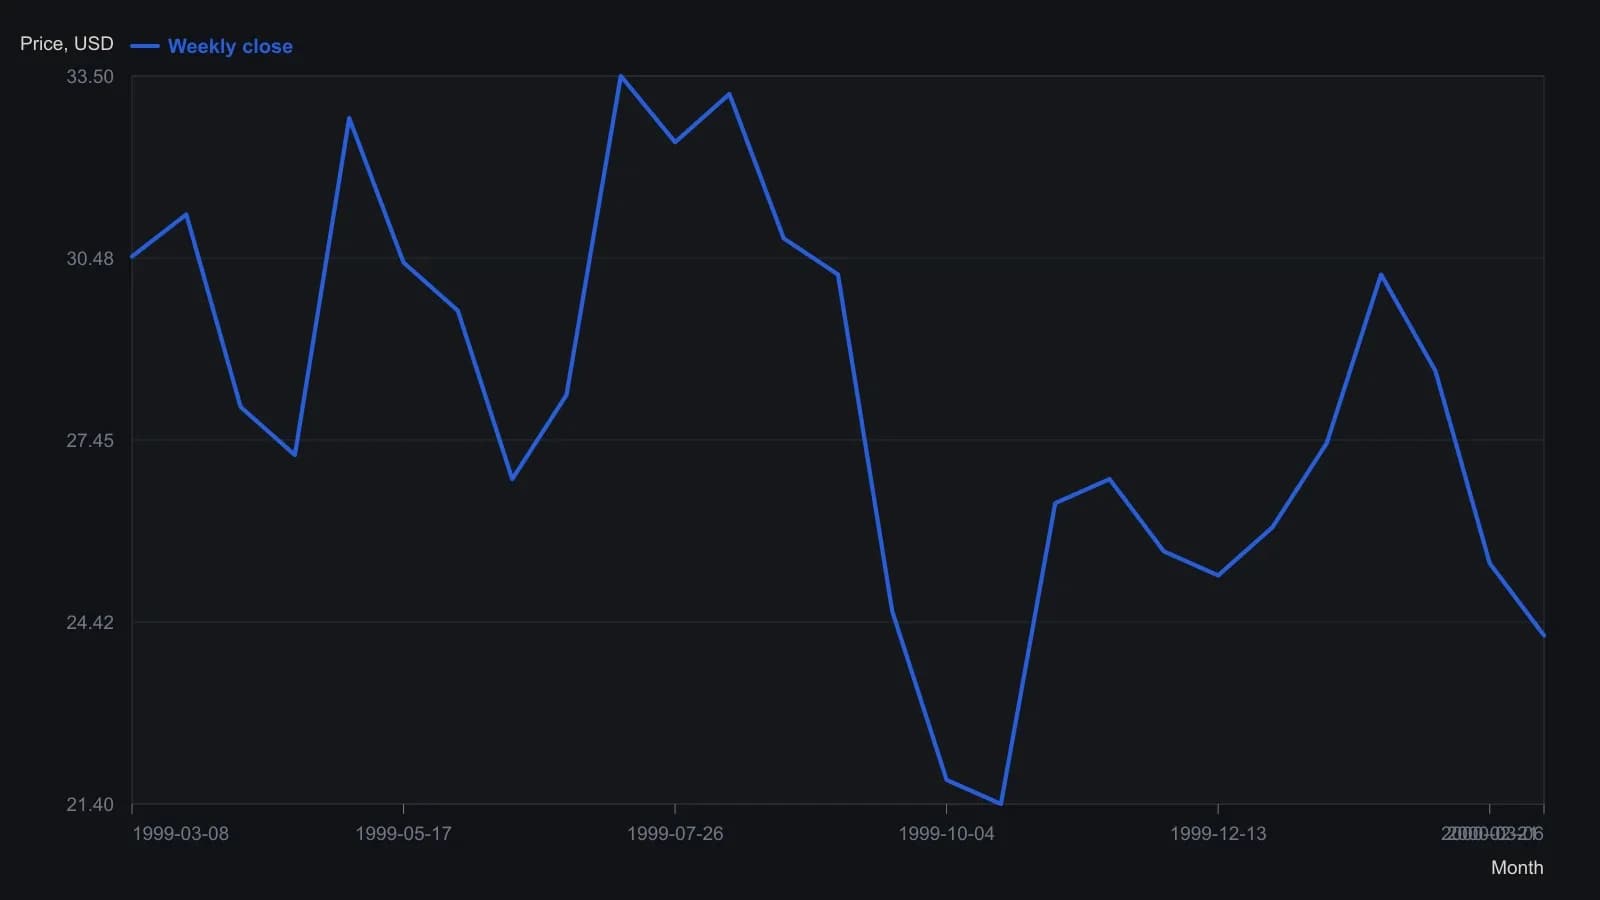
Weekly closes sampled from the magazine raster (at most one point per labeled month tick plus turning weeks). Intraday highs and lows and the volume pane were not digitized. Y values are approximate to about half a point.
Unlike troughs come first
Twin troughs are classed as Adam then Eve only when the first low is narrow and pointed, the second is wider, rounded, or flat, and the two shapes look distinctly unlike each other. Volume is described as usually heaviest on the Adam low rather than the Eve low. An Eve trough may be built from several nearby minor lows.
The intervening rally must already exist
The setup is placed in a downtrend, with the two lows several weeks apart, an intervening rally of at least 10 percent, and bottoms that sit close in price. Those pieces have to be visible before the pair is even a candidate.
Nested structures still need two close lows
An Eve trough can sit inside a larger head-and-shoulders or cup-with-handle structure without dropping the double-bottom reading if the two main lows remain close in price.
Confirmation is a close through the intervening high
Breakout confirmation is a close above the highest high between the two bottoms. That close is treated as the primary test that the twin-bottom sketch is complete. Price is described as often continuing lower before that close, so unconfirmed twin lows are not treated as a completed pattern.
How nearby resistance is judged
Overhead resistance is any prior high or low, trendline, moving average, round number, earlier pattern, or sideways block that can stall an advance after confirmation. A horizontal consolidation region is a sideways price block located between the start of the downtrend and the pattern high, used when judging whether overhead supply is likely to matter. A nearby block that forms after that downtrend has already begun is treated as weaker resistance that a breakout may pass through.
A shelf trigger, a height-added bound, and invalidation
A support shelf is a flat stretch along the Eve trough that can be read as nearby support. In an untested variant, a close above that shelf is used as an earlier trigger in place of a close through the intervening high. The measure rule adds the distance from the lower trough to the intervening high onto that high and is framed as a minimum expected advance rather than a certainty. Invalidation is a break of nearby support or a drop through the lower of the two bottoms.
All readings on this track · 32 readings
- 1988Reaction length as a trend integrity test
- 1991Sold-out double bottoms as a three-gate inventory test
- 1991A breadth classifier for V-bottoms and W-bottoms
- 1991Precomputed price-ratio clusters and double-top tests
- 1992Bond turning points as a regime check on equity double tops and breakouts
- 1992Commodity-bond ratio as an equity regime overlay
- 1992Gold lead confirmation for commodity-index turns
- 1994Constructing the thousand-line advance-decline indicator
- 1995Evaluating zero-line patterns on a breadth-price oscillator
- 1996Constructing double tops from a resistance retest to a trough break
- 1996Four-stage double-bottom construction
- 1998Double-bottom confirmation and stop placement
- 2000Two-bar reversal construction
- 2001Constructing double tops from failed resistance retests
- 2002Eve-Eve double bottoms: width, confirmation, and overhead resistance
- 2002Constructing Eve-and-Eve and classic double bottoms
- 2003Eve-Adam double bottoms as a two-step classroom test
- 2003Shape contrast then breakout confirmation in Adam and Eve double bottoms
- 2003Reading cyclical bottoms inside secular bear regimes
- 2004A case study of the shark-attack Fibonacci retracement
- 2004Confirming index turns with envelopes, divergence, and breadth
- 2005A five-wave euro/dollar case and the support that still had to fail
- 2007Constructing commodity seasonal indexes for regime context
- 2009Constructing rounded and double-top short setups
- 2010Hourly pattern entries, exits, and abstention as one playbook
- 2016Ugly double bottom after a yearly low
- 2016An unconfirmed stock double bottom next to a confirmed index
- 2016Constructing a range-midpoint moving average
- 2017Evaluating whole-dollar delays on pattern breakouts
- 2018Volume-confirmed bottoms and breakouts with moving averages
- 2018Evaluating double bottoms with a locked stochastic confirmation
- 2019Forex pairs as relative value: yield spreads, support, and a double bottom