2017issue C127
Evaluating whole-dollar delays on pattern breakouts
A 2017 evaluation delayed chart-pattern breakouts when the trigger showed a nine immediately left of the decimal, waiting for fifty cents above the next whole dollar. This article treats that whole-dollar delay as a second test and keeps the fill, the five-percent failure check, and the pattern-low stop locked.
- Editorial reading: treat a double-top or double-bottom breakout as the first hypothesis and the whole-dollar delay as a second, separate test.
- The 2017 evaluation delayed a trigger that showed a nine immediately left of the decimal until price was fifty cents above the next whole dollar.
- The historical sample covered 11077 clear breakouts over 25 years and included double tops, double bottoms, triple formations, and rectangles.
- Editorial reading: lock the fill, the five-percent failure check, and the pattern-low stop so the delay filter can be accepted or rejected without a trade recommendation.
A breakout first, then a waiting rule
A double top or double bottom is a two-peak or two-trough reversal. The historical test treats a break of the intervening extreme as an identifiable long or short event, and it treats a move through the boundary of the completed chart pattern as the breakout that triggers entry.
Editorial reading: keep that breakout as the first hypothesis. Treat the whole-dollar delay as a second, separate test of whether to wait after the trigger appears.
The whole-dollar delay in the 2017 evaluation
A 2017 evaluation delayed chart-pattern breakout entries when the trigger price showed a nine immediately left of the decimal, waiting instead for fifty cents above the next whole dollar.
The historical sample contained 11077 chart patterns with clear breakouts spanning 25 years and included double tops, double bottoms, triple formations, and rectangles.
Modeled fills and exits
Modeled long fills used the higher of the breakout price and the session open. Modeled short fills used the breakout or the session open.
Modeled long exits used the highest high before a 20% decline or a 2-dollar drop below the breakout. Modeled short covers used the lowest low before a 20% rally or a close 2 dollars above the breakout.
The 20% adverse-move cutoff was chosen because it was treated as the index-level swing from a bull phase to a bear phase.
No-nines delay versus all-stock pattern averages
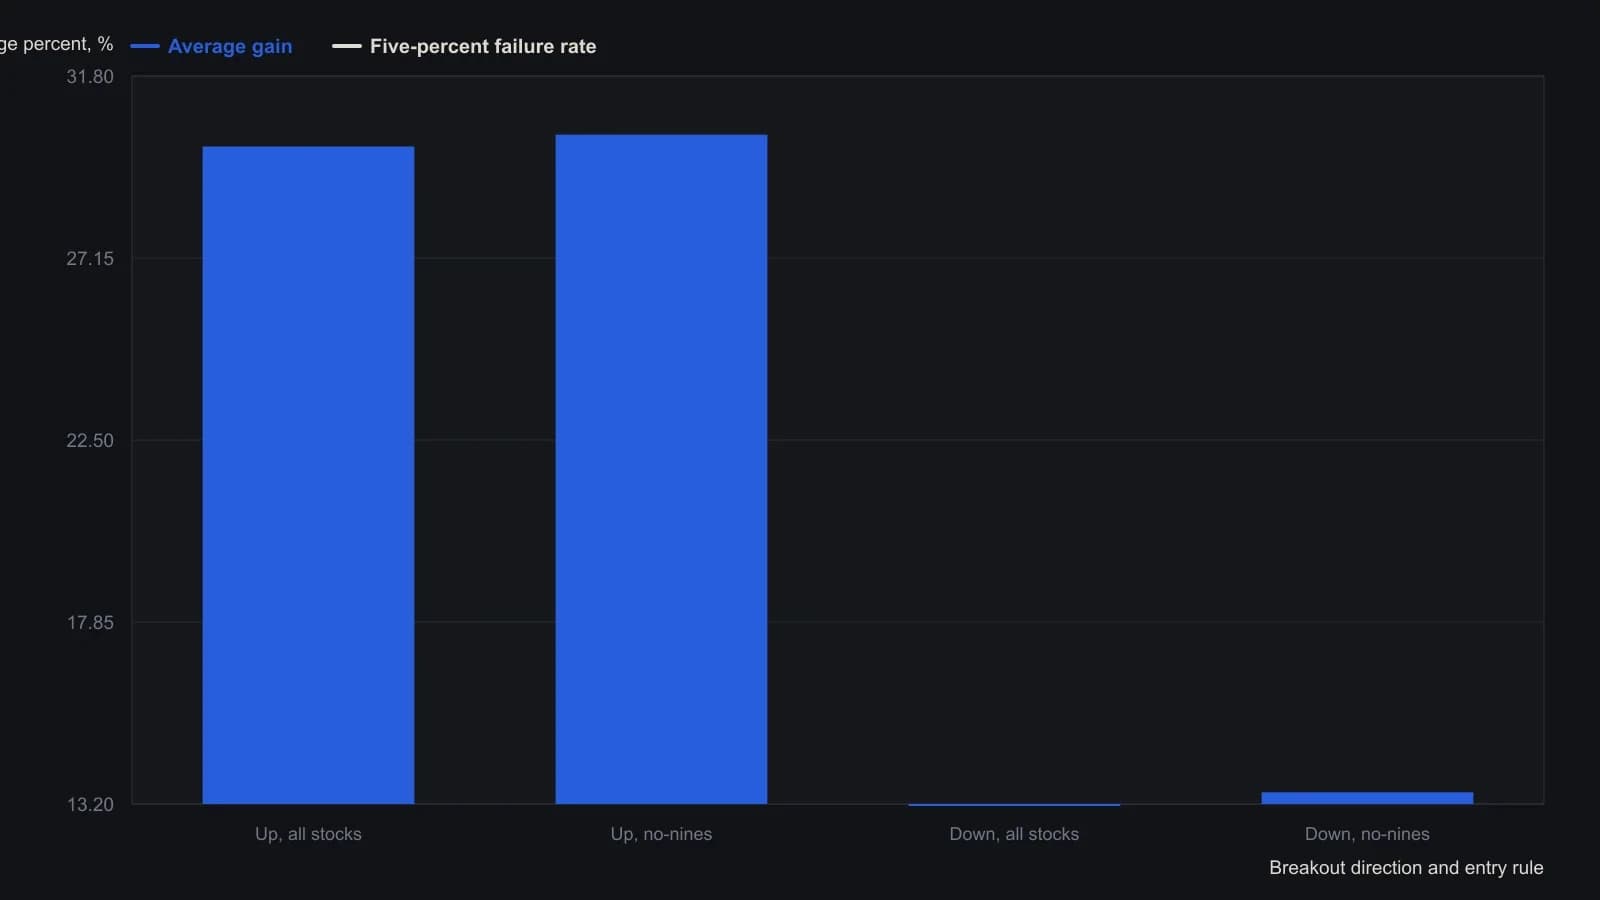
Averages of modeled perfect trades in the $20–70 band: longs fill at the higher of breakout or open and exit at the highest high before a 20% drop or a $2 breakout giveback; shorts are mirrored. The table does not include the separate pattern-low stop test.
Five-percent failure, price band, and stops
A breakout was counted as a five-percent failure when price did not extend at least 5% after the trigger.
The tabulated comparison was limited to stocks priced from 20 to 70 dollars and split the sample into upward and downward breakouts. The rule set under review specified a 20-to-70-dollar price band and a 2-dollar stop.
A second test condition placed a pattern-low stop one cent below the bottom of the chart pattern rather than a fixed dollar distance from the fill.
Editorial reading: lock three items, vary one
Editorial reading: lock the modeled fill, the five-percent failure check, and the pattern-low stop. Then accept or reject only the whole-dollar delay. That keeps the waiting rule falsifiable and keeps the chart from becoming a recommendation.
All readings on this track · 32 readings
- 1988Reaction length as a trend integrity test
- 1991Sold-out double bottoms as a three-gate inventory test
- 1991A breadth classifier for V-bottoms and W-bottoms
- 1991Precomputed price-ratio clusters and double-top tests
- 1992Bond turning points as a regime check on equity double tops and breakouts
- 1992Commodity-bond ratio as an equity regime overlay
- 1992Gold lead confirmation for commodity-index turns
- 1994Constructing the thousand-line advance-decline indicator
- 1995Evaluating zero-line patterns on a breadth-price oscillator
- 1996Constructing double tops from a resistance retest to a trough break
- 1996Four-stage double-bottom construction
- 1998Double-bottom confirmation and stop placement
- 2000Two-bar reversal construction
- 2001Constructing double tops from failed resistance retests
- 2002Eve-Eve double bottoms: width, confirmation, and overhead resistance
- 2002Constructing Eve-and-Eve and classic double bottoms
- 2003Eve-Adam double bottoms as a two-step classroom test
- 2003Shape contrast then breakout confirmation in Adam and Eve double bottoms
- 2003Reading cyclical bottoms inside secular bear regimes
- 2004A case study of the shark-attack Fibonacci retracement
- 2004Confirming index turns with envelopes, divergence, and breadth
- 2005A five-wave euro/dollar case and the support that still had to fail
- 2007Constructing commodity seasonal indexes for regime context
- 2009Constructing rounded and double-top short setups
- 2010Hourly pattern entries, exits, and abstention as one playbook
- 2016Ugly double bottom after a yearly low
- 2016An unconfirmed stock double bottom next to a confirmed index
- 2016Constructing a range-midpoint moving average
- 2017Evaluating whole-dollar delays on pattern breakouts
- 2018Volume-confirmed bottoms and breakouts with moving averages
- 2018Evaluating double bottoms with a locked stochastic confirmation
- 2019Forex pairs as relative value: yield spreads, support, and a double bottom