2016issue C018-11
Ugly double bottom after a yearly low
An ugly double bottom is a first valley followed by a higher second valley, searched only after a yearly low in a rising market. The historical workflow treats that shape as an entry only after pattern-confirmation, a pre-placed stop, and a chosen exit.
- An ugly double bottom uses a higher second valley rather than two valleys at or near the same price.
- The historical search applies a bull-market-filter and a yearly-low-first-bottom constraint, so the first valley is extreme weakness inside a rising market.
- The structure stays a chart hypothesis until a close above the pattern top, a protective stop, and a chosen exit form one rule set.
- A stop below the first bottom is the preferred placement because new-low stocks often print still lower lows; that depth is treated as a structural flaw, not as tight short-term risk control.
What an ugly double bottom is
An ugly double bottom is defined as a first valley followed by a second, higher valley. That shape differs from a traditional double bottom, whose valleys sit at or near the same price.
The second bottom is required to stand inside a bottom-separation-band above the first, so the pair is a higher-valley structure rather than a matched one.
Where the search is allowed
The historical workflow searched the setup only under a bull-market-filter. It also required a yearly-low-first-bottom: the stock had to be making a new yearly low, and that yearly low had to be the first bottom of the higher-valley pair.
Bottoms were located as the lowest low inside a short window around each candidate. Until pattern-confirmation, the higher valley is not treated as a valid setup.
Confirmation and entry
The pattern becomes valid only at pattern-confirmation, when price closes above the top of the two-valley structure. The close filter is intended to skip one-day spikes.
After that close, the historical workflow used a next-day open buy or a buy stop just above the pattern top.
Stops, targets, and holding period
A stop just below the first bottom is the preferred protective placement. A stop below the second bottom is the tighter alternative.
The archive treats the deep first-bottom stop as a structural flaw that is still needed, because new-low stocks often make still lower lows. In the archive example, a stop under the second bottom would have been hit on a later dip.
A height-multiple-target was used as the measured exit, projecting a multiple of the pattern height above the pattern top or the buy price. Tall patterns are described as helpful, but they do not guarantee a trend change.
The same workflow presents the setup as better suited to longer holding periods than to tight short-term risk.
Manpower ugly double bottom after the 2014 yearly low
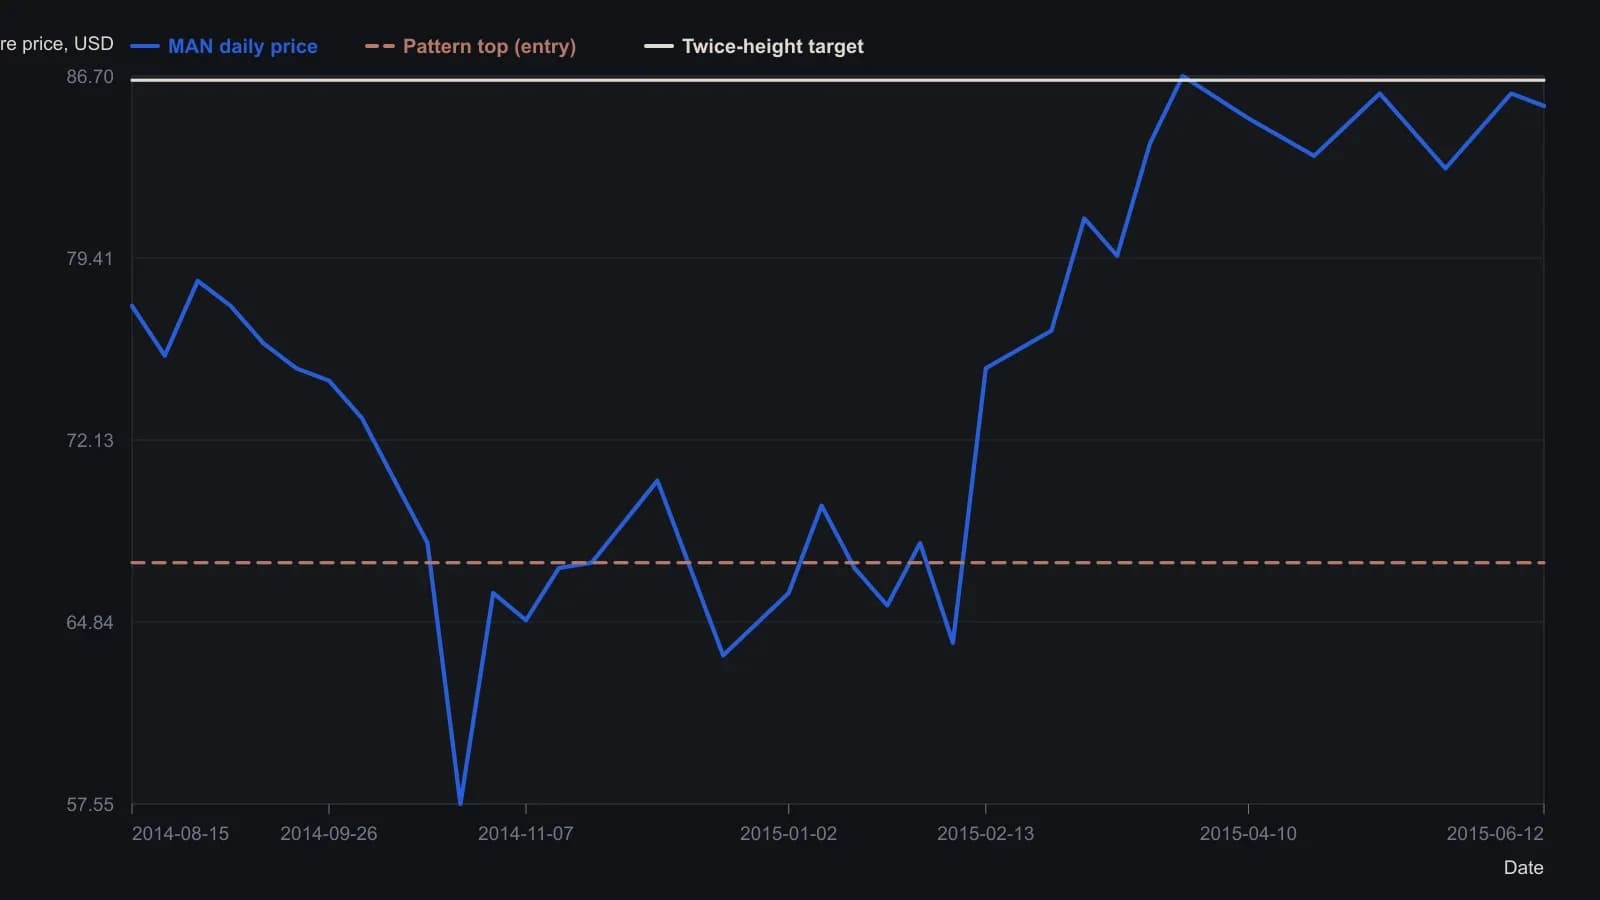
Preferred setup in the source: bottoms 10–20 percent apart (13 percent here), buy stop a penny above the pattern top, objective at twice the pattern height. Unlabeled vertices are approximate candlestick reads, not tick data.
All readings on this track · 32 readings
- 1988Reaction length as a trend integrity test
- 1991Sold-out double bottoms as a three-gate inventory test
- 1991A breadth classifier for V-bottoms and W-bottoms
- 1991Precomputed price-ratio clusters and double-top tests
- 1992Bond turning points as a regime check on equity double tops and breakouts
- 1992Commodity-bond ratio as an equity regime overlay
- 1992Gold lead confirmation for commodity-index turns
- 1994Constructing the thousand-line advance-decline indicator
- 1995Evaluating zero-line patterns on a breadth-price oscillator
- 1996Constructing double tops from a resistance retest to a trough break
- 1996Four-stage double-bottom construction
- 1998Double-bottom confirmation and stop placement
- 2000Two-bar reversal construction
- 2001Constructing double tops from failed resistance retests
- 2002Eve-Eve double bottoms: width, confirmation, and overhead resistance
- 2002Constructing Eve-and-Eve and classic double bottoms
- 2003Eve-Adam double bottoms as a two-step classroom test
- 2003Shape contrast then breakout confirmation in Adam and Eve double bottoms
- 2003Reading cyclical bottoms inside secular bear regimes
- 2004A case study of the shark-attack Fibonacci retracement
- 2004Confirming index turns with envelopes, divergence, and breadth
- 2005A five-wave euro/dollar case and the support that still had to fail
- 2007Constructing commodity seasonal indexes for regime context
- 2009Constructing rounded and double-top short setups
- 2010Hourly pattern entries, exits, and abstention as one playbook
- 2016Ugly double bottom after a yearly low
- 2016An unconfirmed stock double bottom next to a confirmed index
- 2016Constructing a range-midpoint moving average
- 2017Evaluating whole-dollar delays on pattern breakouts
- 2018Volume-confirmed bottoms and breakouts with moving averages
- 2018Evaluating double bottoms with a locked stochastic confirmation
- 2019Forex pairs as relative value: yield spreads, support, and a double bottom