2018issue C0626-29
Volume-confirmed bottoms and breakouts with moving averages
This editorial lesson treats a 2018 bullish-pattern case study as a three-lock classroom drill. Mark a bottom or channel that can fail in public, wait for a volume-backed break of a drawn line, and only then ask whether a 50-day average agrees.
- Repeated tests of a similar low define a shelf; a double, triple, or multibottom stays incomplete until nearby resistance is broken.
- Volume confirmation is a dry-up toward or below a 30-day average of volume, then a spike as price clears the upper horizontal line or channel top.
- A 50-day average appears in the cases as a reclaim after a third bottom, the line a multibottom must cut, or a rail price hugs before a news-driven trendline jump.
- A cup-and-handle needs a left-side lip, a 15% to 30% decline, a handle near that lip, and a later breakout to new highs, yet thin names can still lag fills by six to 10 minutes.
A smaller toolkit
A 2018 bullish-pattern case study reduced the toolkit to chart geometry plus volume rather than a large indicator stack.
First lock: a bottom or channel that can fail
In this workflow, repeated tests of a similar high or low define a shelf. Later tests may print as a double, triple, or multi-bottom sequence and stay incomplete until nearby resistance or support is broken.
A triple-bottom case showed heavy volume on the first low, lighter volume on later tests, then a reclaim of a 50-day moving average after the third bottom.
A multibottom was defined as two to six lows that need not share the same price and may form higher lows over months or years before a break through a 50-day moving average.
A corkscrew channel was described as a tight, winding range whose gap through the upper boundary on expanding volume was treated as the power event.
Second lock: a volume-backed break
A breakout here is a gap or push through a previously drawn channel top, horizontal resistance, or descending trendline that can be marked right or wrong on the same bar.
Inside the corkscrew example, volume was said to recede toward or below a 30-day average of volume, then spike as price cleared the upper horizontal line.
That shift from drying or below-average volume inside the pattern to a spike as the boundary breaks is the volume confirmation used in the case.
A technical buy area was defined as a break above prior short- to medium-term resistance on above-average volume.
Third lock: the fifty-day average
The moving average in these cases is a simple average of recent closes used as a reclaim line, a support rail, or a filter that either agrees with the breakout or keeps the idea unconfirmed.
The fifty-day average is a 50-session simple average of price. In the archive examples it appears as a reclaim after a triple bottom, the line a multibottom must cut, or a rail that price hugged before a news-driven jump through a descending trendline.
An explosive-breakout case treated a news-driven jump through a descending trendline after price had been hugging a 50-day moving average.
Facebook daily close and 50-day average, Nov 2016–May 2017
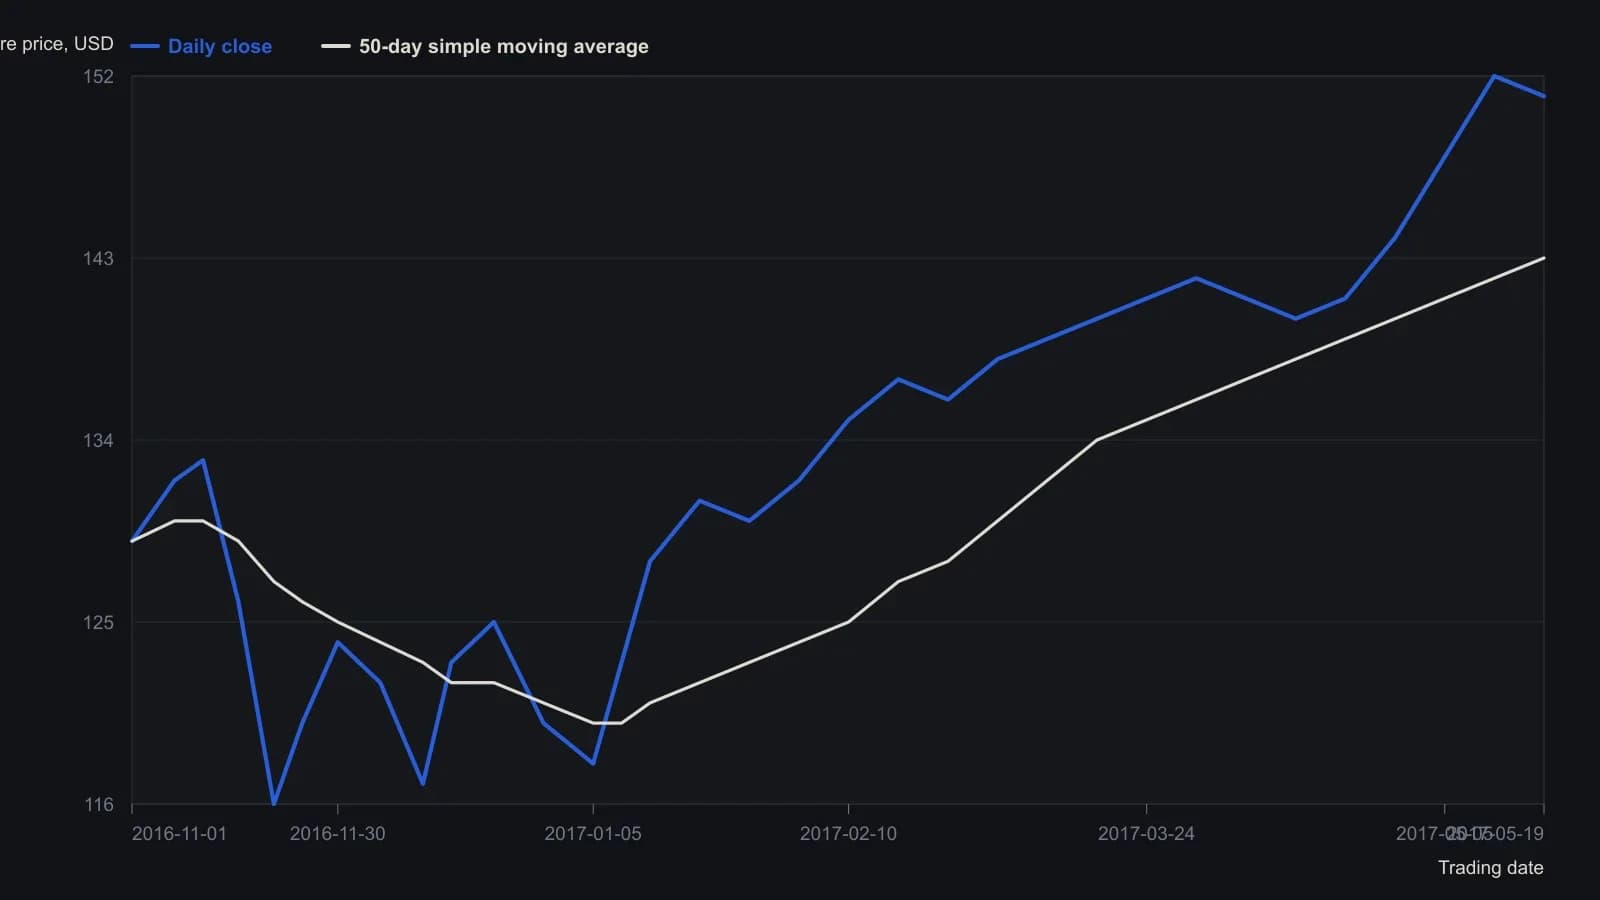
Closes follow candlestick bodies on the scanned daily chart, so readings are whole dollars and can miss a print or two versus official data. Volume is described in the lesson but is not plotted on this price axis.
Cup-and-handle still needs a public break
A cup-and-handle was specified as a left-side lip, a 15% to 30% decline, a handle near or below that lip, and a later breakout to new highs, preferably in a strong tape.
Editorial note: the named shape is still only a hypothesis until that later breakout can be marked. The volume and fifty-day locks above are what keep the idea public and falsifiable on the same session.
A valid sketch can still be hard to fill
A thinly traded cup-and-handle example was used to show that fills could lag by six to 10 minutes, so a valid-looking pattern could still be hard to execute.
How the tape was sliced
The same case contrasted pre-decimal block liquidity with later algorithmic slices of 100 to 200 shares that could still reach 100,000 shares in one trade after the 2000 decimal change.
All readings on this track · 32 readings
- 1988Reaction length as a trend integrity test
- 1991Sold-out double bottoms as a three-gate inventory test
- 1991A breadth classifier for V-bottoms and W-bottoms
- 1991Precomputed price-ratio clusters and double-top tests
- 1992Bond turning points as a regime check on equity double tops and breakouts
- 1992Commodity-bond ratio as an equity regime overlay
- 1992Gold lead confirmation for commodity-index turns
- 1994Constructing the thousand-line advance-decline indicator
- 1995Evaluating zero-line patterns on a breadth-price oscillator
- 1996Constructing double tops from a resistance retest to a trough break
- 1996Four-stage double-bottom construction
- 1998Double-bottom confirmation and stop placement
- 2000Two-bar reversal construction
- 2001Constructing double tops from failed resistance retests
- 2002Eve-Eve double bottoms: width, confirmation, and overhead resistance
- 2002Constructing Eve-and-Eve and classic double bottoms
- 2003Eve-Adam double bottoms as a two-step classroom test
- 2003Shape contrast then breakout confirmation in Adam and Eve double bottoms
- 2003Reading cyclical bottoms inside secular bear regimes
- 2004A case study of the shark-attack Fibonacci retracement
- 2004Confirming index turns with envelopes, divergence, and breadth
- 2005A five-wave euro/dollar case and the support that still had to fail
- 2007Constructing commodity seasonal indexes for regime context
- 2009Constructing rounded and double-top short setups
- 2010Hourly pattern entries, exits, and abstention as one playbook
- 2016Ugly double bottom after a yearly low
- 2016An unconfirmed stock double bottom next to a confirmed index
- 2016Constructing a range-midpoint moving average
- 2017Evaluating whole-dollar delays on pattern breakouts
- 2018Volume-confirmed bottoms and breakouts with moving averages
- 2018Evaluating double bottoms with a locked stochastic confirmation
- 2019Forex pairs as relative value: yield spreads, support, and a double bottom