2016issue C0848-55
Constructing a range-midpoint moving average
A range-midpoint replaces the close with the average of the highest high and lowest low over a stated lookback. That series is then smoothed into a middle-high-low-average and paired with a close-based-average through a moving-average-crossover.
- The first stage builds a range-midpoint from the highest high and lowest low over a stated lookback, instead of using the close.
- The second stage applies a simple or exponential moving average to that midpoint series, producing a middle-high-low-average.
- Trend-following signals are moving-average-crossover events between a close-based-average and the range-midpoint average.
- A worksheet pairs a double-bottom breakout with that crossover as a combined chart condition rather than using the crossover alone.
Build the midpoint, then smooth it
The first construction step forms a range-midpoint series by averaging the highest high and lowest low over a stated lookback instead of using the close. That range-midpoint is the average of those two extremes inside the chosen lookback, used in place of the close.
That midpoint series is then smoothed with either a simple or an exponential moving average over a second length. The smoothed line is a middle-high-low-average: a moving average applied to the range-midpoint series rather than to closing prices.
Those two stages are a double-smoothed-construction. First reduce each bar to a range midpoint, then smooth that series.
Keep the range window and the smoother separate
Coded examples expose two separate inputs, a high-low range period and a smoothing length, with sample pairings of 10 and 50, or 3 and 10. Those two lengths are not the same control.
A type switch lets the same template plot either simple or exponential versions of both the range-midpoint average and the close-based-average. The close-based-average is a simple or exponential moving average of closes plotted as the crossover partner.
Inspect lag on the unsmoothed series
Unsmoothed midpoint plots with range lookbacks of 3, 15, and 35 bars are used to inspect how response lag grows as the window lengthens. That check belongs to the first stage of the double-smoothed-construction, before a second length is applied.
DJIA 35-session high-low midpoint, March 2012–July 2013
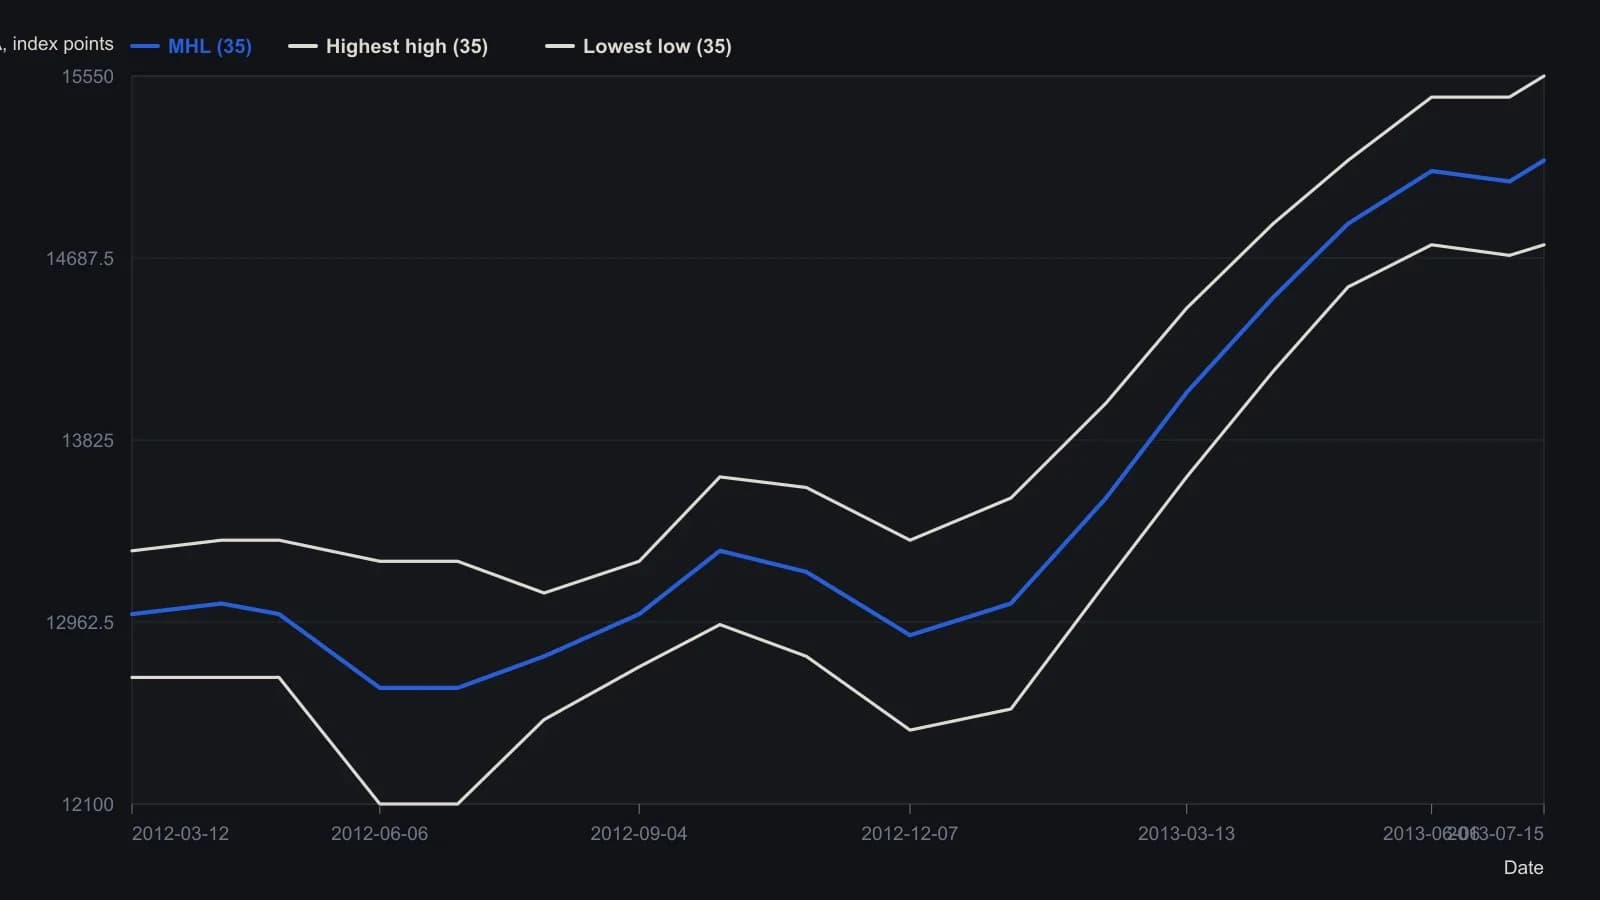
Ron McAllister Excel Traders' Tips workbook, August 2016. Window is 348 daily bars; MHL lookback 35 sessions; 10-session SMA and 50-session EMA overlays were unchecked so only the raw midpoint and its high/low bounds are plotted. Y-values are approximate to about 50 index points.
Define signals as a close-based crossover
Trend-following signals are defined as crossovers between the close-based-average and the range-midpoint average. That directional event is a moving-average-crossover: the close-based-average crossing the range-midpoint average.
One strategy buys the next bar at market when the close-based-average crosses above the range-midpoint average and sells short the next bar when it crosses below.
Another long-only loop enters on an upward cross of the close-based-average through the range-midpoint average and exits on the reverse cross.
Add a double-bottom only as a chart condition
A worksheet example pairs a double-bottom breakout with a range-midpoint crossover as a combined chart condition rather than using the crossover alone. The double-bottom is a two-trough price structure used with the crossover as that combined chart condition.
All readings on this track · 32 readings
- 1988Reaction length as a trend integrity test
- 1991Sold-out double bottoms as a three-gate inventory test
- 1991A breadth classifier for V-bottoms and W-bottoms
- 1991Precomputed price-ratio clusters and double-top tests
- 1992Bond turning points as a regime check on equity double tops and breakouts
- 1992Commodity-bond ratio as an equity regime overlay
- 1992Gold lead confirmation for commodity-index turns
- 1994Constructing the thousand-line advance-decline indicator
- 1995Evaluating zero-line patterns on a breadth-price oscillator
- 1996Constructing double tops from a resistance retest to a trough break
- 1996Four-stage double-bottom construction
- 1998Double-bottom confirmation and stop placement
- 2000Two-bar reversal construction
- 2001Constructing double tops from failed resistance retests
- 2002Eve-Eve double bottoms: width, confirmation, and overhead resistance
- 2002Constructing Eve-and-Eve and classic double bottoms
- 2003Eve-Adam double bottoms as a two-step classroom test
- 2003Shape contrast then breakout confirmation in Adam and Eve double bottoms
- 2003Reading cyclical bottoms inside secular bear regimes
- 2004A case study of the shark-attack Fibonacci retracement
- 2004Confirming index turns with envelopes, divergence, and breadth
- 2005A five-wave euro/dollar case and the support that still had to fail
- 2007Constructing commodity seasonal indexes for regime context
- 2009Constructing rounded and double-top short setups
- 2010Hourly pattern entries, exits, and abstention as one playbook
- 2016Ugly double bottom after a yearly low
- 2016An unconfirmed stock double bottom next to a confirmed index
- 2016Constructing a range-midpoint moving average
- 2017Evaluating whole-dollar delays on pattern breakouts
- 2018Volume-confirmed bottoms and breakouts with moving averages
- 2018Evaluating double bottoms with a locked stochastic confirmation
- 2019Forex pairs as relative value: yield spreads, support, and a double bottom