1995issue C091-6
Evaluating zero-line patterns on a breadth-price oscillator
A short-range oscillator built from daily advances, unchanged issues, and industrial-average closes is read against a zero line of neutral values. The evaluation specified depth, recovery, duration, and failed-hold rules and recommended a catalog of pattern-and-outcome statements over informal indicator stories.
- Named patterns are defined by how the short-range oscillator leaves the zero line and returns to it, with a stated depth and a stated completion window.
- Market breadth enters through daily advance and unchanged counts used with industrial-average closes, so the reading reflects how widely a session is shared.
- Overbought and oversold position lines mark stretched or persistent readings of 4.0 or higher and -4.0 or lower; those states can persist.
- Failed holds and persistence windows are coded as separate conditions, and the evaluation recommended a catalog of pattern-and-outcome rules instead of informal indicator stories.
A short-range oscillator under price
A basic oscillator can be the gap between a session close and a 20-day simple moving average of closes, plotted under price so oscillator shapes can be compared with the market path.
A short-range oscillator can combine daily advances, daily unchanged issues, and industrial-average closes, using each series gap from its moving average. Daily advance and unchanged counts are used with index closes so the reading reflects how widely a session is shared, not only how far one average moved.
Pattern reading starts at the zero line
Charts of that oscillator use a horizontal zero line of neutral values, and pattern reading is defined relative to that line. Named patterns are defined by how values leave that line and return to it.
Overbought and oversold position lines
Standard thresholds treated readings of 4.0 or higher as overbought and readings of -4.0 or lower as oversold, with the caveat that those states can persist.
Horizontal oscillator thresholds, including a zero or neutral reference, are used to mark stretched, failed, or persistent position relative to recent averages.
Editorial reading: keep those generic overbought and oversold prints as the control case. The named condition is the rule written against the zero line, not the first print beyond a threshold.
Double-top and double-bottom rules
A double-top or double-bottom is two successive oscillator excursions away from a neutral line and back, each with a stated depth and a stated completion window.
A double-bottom rule was specified as two drops from the zero line to -2.3 or lower, each recovering to the line or above, inside a six-to-ten-week window.
A double-top rule was specified as two rises from the zero line to +2.8 or higher that returned to the line in four to eight weeks, with some cases extending toward twelve weeks.
A higher double-top rule was specified as a move to +4.2 or more, a retreat to +2.7 or lower, and a return to +4.2 or higher in less than eight weeks.
Failed holds and persistence windows
Failed holds were coded separately. A failed hold is a crossing of the zero line that never reaches a stated height or depth before reversing. The coded cases were a climb that stayed no higher than +1.3, or a dip only into the -1.5 to -2.1 band before returning to the zero line.
Duration rules treated five to eight consecutive weeks above +1.0 followed by a drop, and two-and-a-half to three-and-a-half weeks below zero followed by a cross above the line, as single-top and single-bottom conditions. A persistence window is a consecutive multi-week stay above or below a stated oscillator level that is treated as its own setup when the stay later breaks.
Catalog pattern-and-outcome rules
The evaluation organized the oscillator into seven named pattern uses and recommended cataloging pattern-and-outcome rules instead of relying on informal indicator stories.
Dow rallies after 6-to-10-week oscillator double bottoms
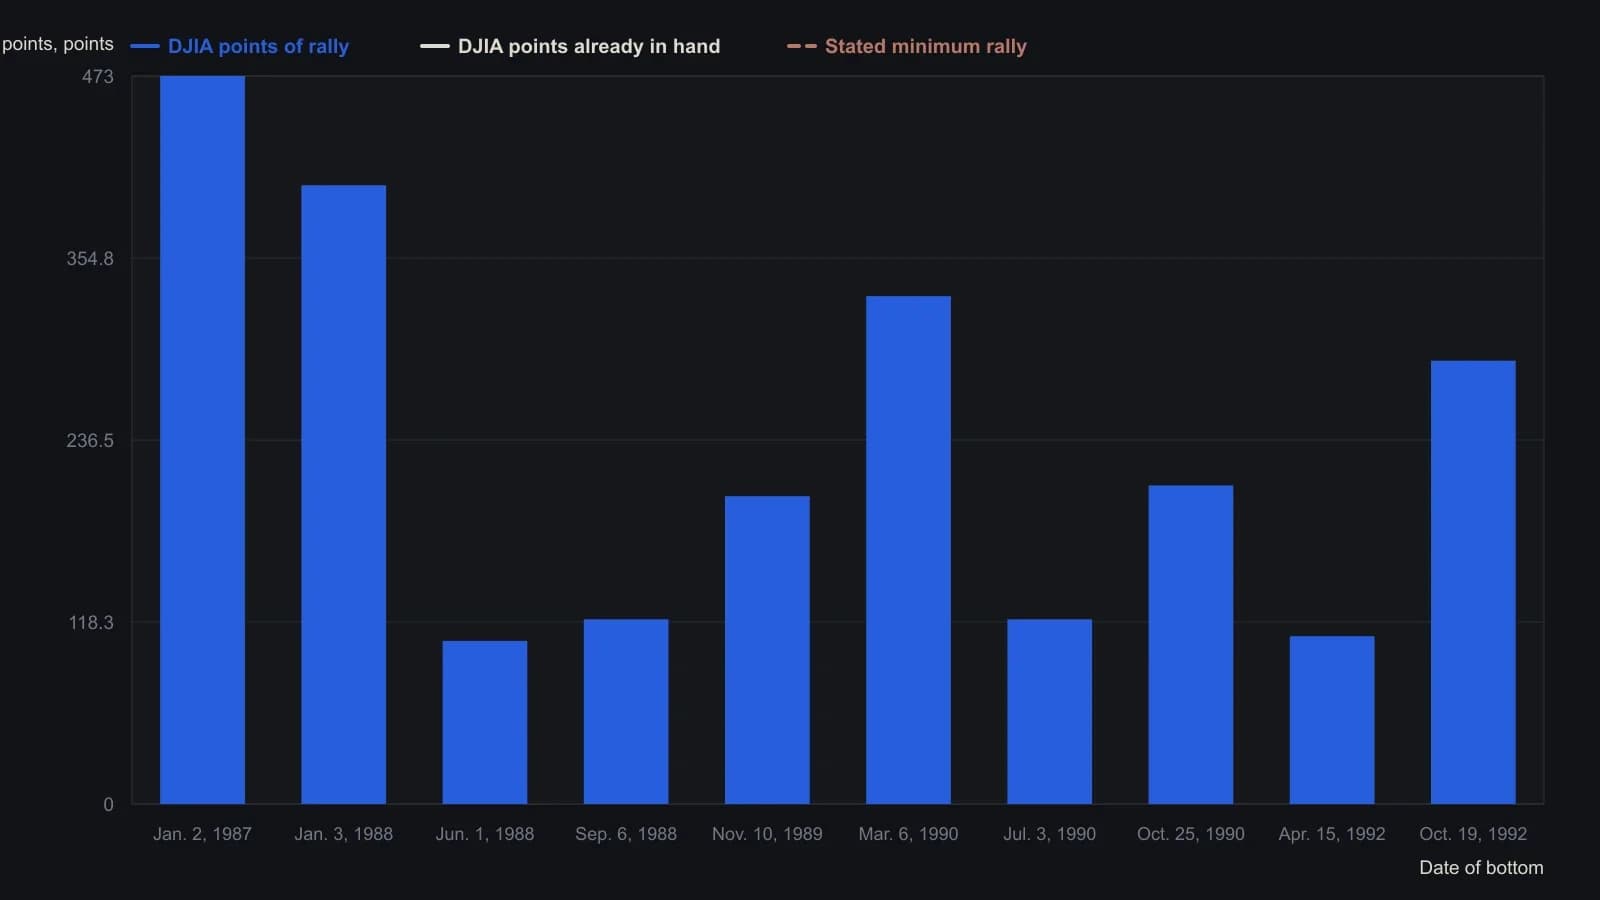
Pattern as defined in the article: two drops from the zero line to -2.3 or lower and two returns to zero, completed in six to ten weeks. The July 3, 1994 row is omitted because the scan cuts off the rally-points cell.
All readings on this track · 32 readings
- 1988Reaction length as a trend integrity test
- 1991Sold-out double bottoms as a three-gate inventory test
- 1991A breadth classifier for V-bottoms and W-bottoms
- 1991Precomputed price-ratio clusters and double-top tests
- 1992Bond turning points as a regime check on equity double tops and breakouts
- 1992Commodity-bond ratio as an equity regime overlay
- 1992Gold lead confirmation for commodity-index turns
- 1994Constructing the thousand-line advance-decline indicator
- 1995Evaluating zero-line patterns on a breadth-price oscillator
- 1996Constructing double tops from a resistance retest to a trough break
- 1996Four-stage double-bottom construction
- 1998Double-bottom confirmation and stop placement
- 2000Two-bar reversal construction
- 2001Constructing double tops from failed resistance retests
- 2002Eve-Eve double bottoms: width, confirmation, and overhead resistance
- 2002Constructing Eve-and-Eve and classic double bottoms
- 2003Eve-Adam double bottoms as a two-step classroom test
- 2003Shape contrast then breakout confirmation in Adam and Eve double bottoms
- 2003Reading cyclical bottoms inside secular bear regimes
- 2004A case study of the shark-attack Fibonacci retracement
- 2004Confirming index turns with envelopes, divergence, and breadth
- 2005A five-wave euro/dollar case and the support that still had to fail
- 2007Constructing commodity seasonal indexes for regime context
- 2009Constructing rounded and double-top short setups
- 2010Hourly pattern entries, exits, and abstention as one playbook
- 2016Ugly double bottom after a yearly low
- 2016An unconfirmed stock double bottom next to a confirmed index
- 2016Constructing a range-midpoint moving average
- 2017Evaluating whole-dollar delays on pattern breakouts
- 2018Volume-confirmed bottoms and breakouts with moving averages
- 2018Evaluating double bottoms with a locked stochastic confirmation
- 2019Forex pairs as relative value: yield spreads, support, and a double bottom