2004issue C081-5
Confirming index turns with envelopes, divergence, and breadth
On daily charts of major stock indexes, a turning-point setup stays a falsifiable hypothesis until price is at a moving-average envelope extreme, a price-oscillator divergence appears, and advancing-volume breadth contracts or rolls over. Double tops, double bottoms, and envelope touches do not complete the case on their own.
- Use the daily moving-average envelope only to mark whether an index swing is at an extreme relative to a typical range around the 21-day average.
- Treat a stalled double top or double bottom as a structural clue, then require a price-oscillator disagreement such as unconfirmed highs or lows on a 14-period RSI.
- Read the 10-day average of advancing volume for a contraction toward a recurring baseline or a rollover after failed rallies, not as a fixed top or bottom level.
- Keep envelope location, divergence, and breadth in agreement before treating a reversal idea as a testable timing hypothesis.
A three-check drill on the daily chart
Editorial framing: TradersWeek teaches index turning points as a three-check confirmation drill on the daily chart. First locate price at a moving-average envelope extreme. Then require a price-oscillator disagreement. Then require a breadth contraction or rollover in advancing volume.
In that framing, a double top, a double bottom, or an envelope touch stays a falsifiable hypothesis until divergence and breadth independently agree. The archive itself requires envelope location, oscillator divergence, and breadth to confirm one another rather than be used in isolation.
Locate the envelope extreme
On daily charts of major stock indexes, prices are described as typically fluctuating about 3 to 4 percent above or below a 21-day simple moving average of the close. Those percentages are used to draw envelope bands that mark high and low extremes.
Envelope width is treated as trend- and market-dependent. A common starting width is 3 percent for the S&P and Dow industrials. Strong trends may require 4 to 5 percent or more. Nasdaq composite envelopes are typically wider, around 5 to 6 percent.
The method is reserved for the larger daily trend rather than hourly or intraday frames. It is described as less consistent on individual stocks than on indexes. An envelope extreme is a touch, second touch, or brief extension through an upper or lower percentage band. It marks an overbought or oversold location without, by itself, proving that the trend has reversed.
Envelope behavior on the daily trend
Seven envelope-behavior rules are listed. Among them, a cross above the 21-day average is treated as potential support with upside room to the upper band. A cross below that average is treated as potential resistance with downside room to the lower band.
A move through a band is treated as more likely to produce a reaction than a large continuation, especially when the swing is countertrend.
A stalled double top is not a reversal
After an early-2004 advance to a 3.5 percent upper envelope, the S&P 500 repeatedly stalled in the 1155-60 zone and failed to reach the upper band again. That stalled structure is presented as a possible double or triple top and as a sign of fading upside momentum, not as a conclusive reversal on its own.
A double top or double bottom is a repeated test of the same resistance or support zone that fails to extend. Here it is only a structural clue. Envelope location, divergence, and breadth still have to confirm the reversal hypothesis.
Require a price-oscillator divergence
Price-oscillator divergence is defined analogously to averages that fail to confirm each other's new highs or lows. If price makes a peak or trough but an oscillator such as a 14-period RSI does not, the disagreement is treated as a warning that the swing may reverse.
From late January through early March 2004, repeated S&P highs in the same area or only marginally higher coincided with successively lower RSI peaks, forming a bearish price/RSI divergence.
The late-March downswing low instead coincided with a slightly higher RSI reading and a second touch of the lower envelope, forming a bullish divergence at an envelope extreme.
S&P 500 daily, October 2003 to March 2004
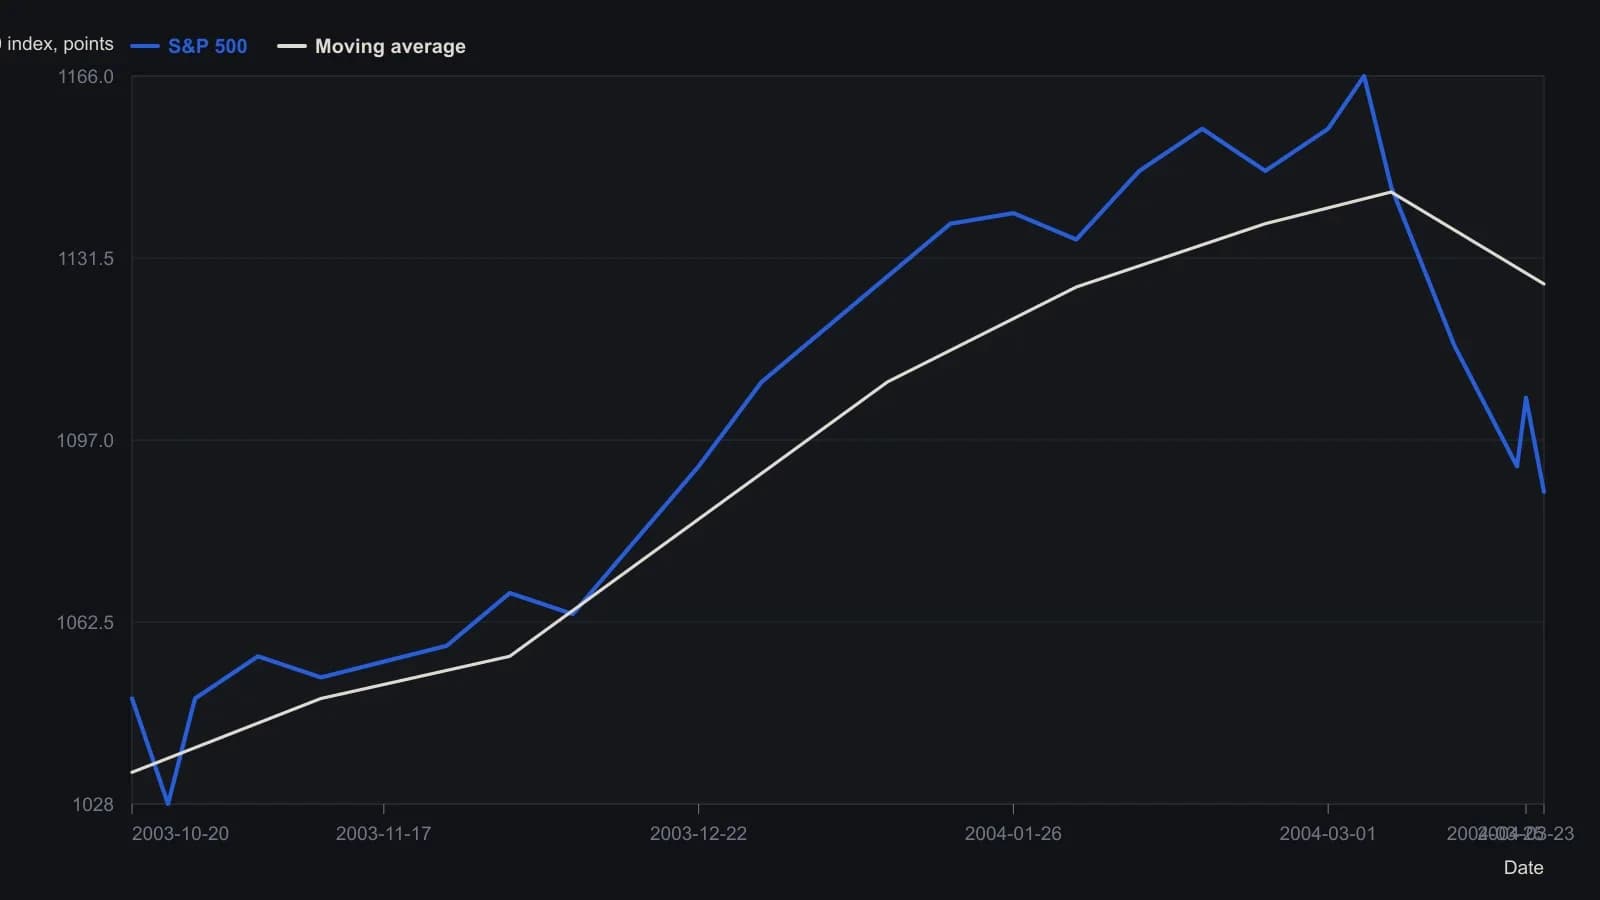
Unlabeled prices are digitized from the 25 March 2004 eSignal raster and rounded to the nearest index point. Only the marked high (1165.99), last close (1087.13), and last average (1126.56) are exact. The article’s 3.5% envelope lines and the RSI trace (last labeled 43.99) are not drawn on this scan, and the NYSE up-volume pane cannot share this price scale.
Check advancing-volume breadth next
Breadth is measured with a 10-day average of NYSE and Nasdaq advancing volume, meaning shares traded on upticks. Multimonth to multiyear stretches are described as forming a recurring contraction baseline for that average. In the illustrated period the NYSE baseline was about 525 to 550 million shares, and dips to it are associated with significant index lows.
Specific levels of declining volume, and specific levels of advancing volume, are described as unreliable markers of index tops. At potential tops, a downturn that continues in the 10-day advancing-volume average is treated only as secondary confirmation, especially when rally attempts fail at resistance while average up volume is shrinking.
After the 10-day advancing-volume average contracted to the illustrated baseline in late November 2003, the index is described as forming an approximate double-bottom low relative to the prior month.
Keep the three checks in agreement
Envelope location, oscillator divergence, and breadth are required to confirm one another rather than be used in isolation. Multi-indicator confirmation is the rule that those three readings should agree before a top or bottom setup is treated as a testable timing hypothesis.
All readings on this track · 32 readings
- 1988Reaction length as a trend integrity test
- 1991Sold-out double bottoms as a three-gate inventory test
- 1991A breadth classifier for V-bottoms and W-bottoms
- 1991Precomputed price-ratio clusters and double-top tests
- 1992Bond turning points as a regime check on equity double tops and breakouts
- 1992Commodity-bond ratio as an equity regime overlay
- 1992Gold lead confirmation for commodity-index turns
- 1994Constructing the thousand-line advance-decline indicator
- 1995Evaluating zero-line patterns on a breadth-price oscillator
- 1996Constructing double tops from a resistance retest to a trough break
- 1996Four-stage double-bottom construction
- 1998Double-bottom confirmation and stop placement
- 2000Two-bar reversal construction
- 2001Constructing double tops from failed resistance retests
- 2002Eve-Eve double bottoms: width, confirmation, and overhead resistance
- 2002Constructing Eve-and-Eve and classic double bottoms
- 2003Eve-Adam double bottoms as a two-step classroom test
- 2003Shape contrast then breakout confirmation in Adam and Eve double bottoms
- 2003Reading cyclical bottoms inside secular bear regimes
- 2004A case study of the shark-attack Fibonacci retracement
- 2004Confirming index turns with envelopes, divergence, and breadth
- 2005A five-wave euro/dollar case and the support that still had to fail
- 2007Constructing commodity seasonal indexes for regime context
- 2009Constructing rounded and double-top short setups
- 2010Hourly pattern entries, exits, and abstention as one playbook
- 2016Ugly double bottom after a yearly low
- 2016An unconfirmed stock double bottom next to a confirmed index
- 2016Constructing a range-midpoint moving average
- 2017Evaluating whole-dollar delays on pattern breakouts
- 2018Volume-confirmed bottoms and breakouts with moving averages
- 2018Evaluating double bottoms with a locked stochastic confirmation
- 2019Forex pairs as relative value: yield spreads, support, and a double bottom