2005issue C091-2
A five-wave euro/dollar case and the support that still had to fail
By the end of December 2004 a five-wave euro/dollar advance that began in late 2000 was counted complete, and the pair later broke the rising wave-2/4 line. A shorter-horizon double top then named a measured objective near 1.20, while intermediate support just above 1.2500 still had to fail before that measure could be reached.
- A five-wave euro/dollar advance that began in late 2000 was counted complete by the end of December 2004, after which the pair declined.
- The later break of the rising line through the wave-2 and wave-4 lows is treated as putting the prior uptrend in question.
- A shorter-horizon double top with a neckline near 1.2750 named a measured objective near 1.20, while November 2003 intermediate support just above 1.2500 still had to break first.
- A completed chart projection still leaves path and timing unspecified, which is the gap between reading the setup and trading it.
What the snapshot records
This case follows a euro/dollar five-wave advance that began in late 2000 and was counted complete by the end of December 2004. After that count the pair declined. Later chart work then added a trendline break, a double top, and a leftover support line that had not yet failed.
Elliott-wave analysis here is a labeled sequence of impulsive and corrective swings used to mark when an advance may be complete and a reversal hypothesis can start. Completing those labels is when the reversal hypothesis can start. It is not, on its own, a claim that a later measured objective is already available.
The wave-2/4 line
Price later broke the rising line connecting the wave-2 and wave-4 lows. A trendline is a line through successive swing lows or highs whose break is treated as evidence that the prior directional structure is in doubt. The case treats this break as putting the prior uptrend in question.
The double top and its measured objective
On a shorter horizon the same market formed a double top with peaks in December 2004 and March 2005. The neckline sat near 1.2750. A double top is a two-peak pattern whose neckline break supplies a measured objective equal to the height of the formation. The neckline is the horizontal support under that double top that, once broken, activates the measured-move calculation. The measured objective taken from the pattern sat near 1.20.
What still held in May 2005
On 23 May 2005 the pair closed at 1.2595 and was trading below its 200-day moving average. Intermediate rising support from November 2003 still held just above 1.2500. Intermediate support is a shorter rising line that can stall a larger reversal until it too is broken. The case is explicit that this line had to break before the 1.20 objective could be reached.
Path versus target
The unresolved path question was whether price would bounce toward 1.27 first or break that intermediate line cleanly. The archive ties that fork to whether earlier shorts near 1.35 took profits or added. Path versus target is the distinction between a chart-derived price objective and the unknown sequence and timing required to reach it. A completed chart projection still leaves path and timing unspecified, which is the gap between reading the setup and trading it.
How the gates sit on this chart
Editorial reading applies that sequence to the archive facts as follows. The completed five-wave count by the end of December 2004 is the first gate: a reversal hypothesis can start. The break of the wave-2/4 line is the second gate: the prior uptrend is now in question. The double top, with peaks in December 2004 and March 2005 and a neckline near 1.2750, is the third gate: it names an objective near 1.20. Intermediate support from November 2003, still holding just above 1.2500 on 23 May 2005, is the fourth gate and the one that had not yet failed.
The May 2005 snapshot therefore sits between the last two gates. The 1.20 objective had been named. The intermediate line had not broken. That is why the open question was still a bounce toward 1.27 versus a clean break of that line, not whether the projection had already been earned. Editorial reading stops there. The archive does not resolve the path, and a named target does not fill in timing.
Euro/dollar daily: double top, 200-day average, and the support still holding
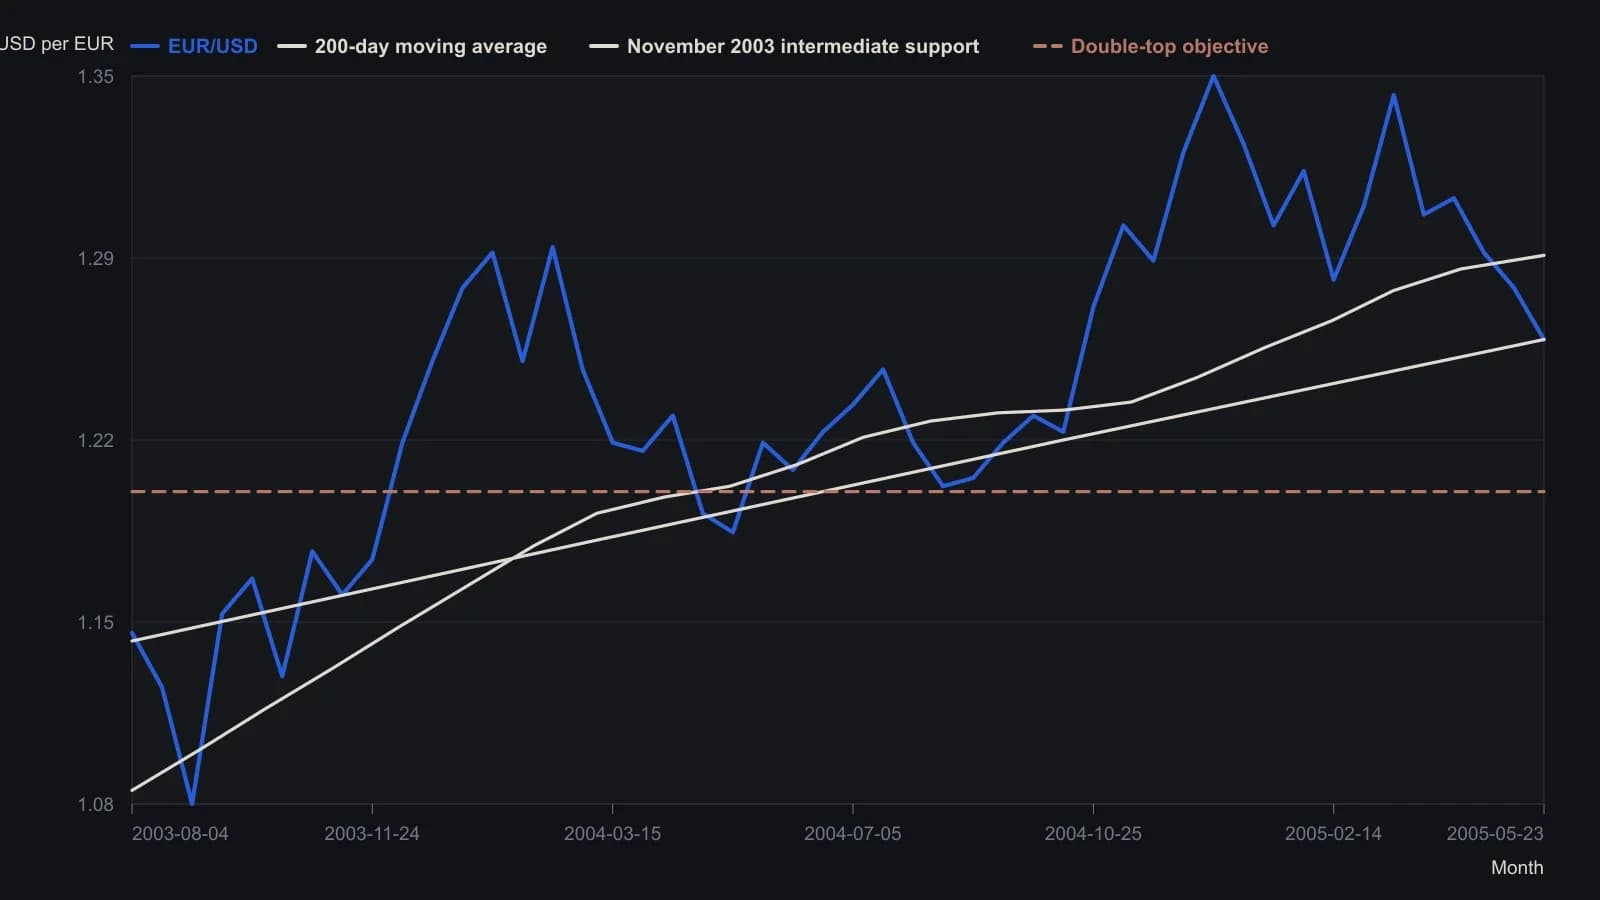
Digitized from the published eSignal raster, not a data table; turning points are only reliable to about 0.005. The article states the 23 May 2005 close as 1.2595; the print sits near 1.256. The horizontal 1.20 series is the measured double-top objective named in the text, not a fitted curve.
All readings on this track · 32 readings
- 1988Reaction length as a trend integrity test
- 1991Sold-out double bottoms as a three-gate inventory test
- 1991A breadth classifier for V-bottoms and W-bottoms
- 1991Precomputed price-ratio clusters and double-top tests
- 1992Bond turning points as a regime check on equity double tops and breakouts
- 1992Commodity-bond ratio as an equity regime overlay
- 1992Gold lead confirmation for commodity-index turns
- 1994Constructing the thousand-line advance-decline indicator
- 1995Evaluating zero-line patterns on a breadth-price oscillator
- 1996Constructing double tops from a resistance retest to a trough break
- 1996Four-stage double-bottom construction
- 1998Double-bottom confirmation and stop placement
- 2000Two-bar reversal construction
- 2001Constructing double tops from failed resistance retests
- 2002Eve-Eve double bottoms: width, confirmation, and overhead resistance
- 2002Constructing Eve-and-Eve and classic double bottoms
- 2003Eve-Adam double bottoms as a two-step classroom test
- 2003Shape contrast then breakout confirmation in Adam and Eve double bottoms
- 2003Reading cyclical bottoms inside secular bear regimes
- 2004A case study of the shark-attack Fibonacci retracement
- 2004Confirming index turns with envelopes, divergence, and breadth
- 2005A five-wave euro/dollar case and the support that still had to fail
- 2007Constructing commodity seasonal indexes for regime context
- 2009Constructing rounded and double-top short setups
- 2010Hourly pattern entries, exits, and abstention as one playbook
- 2016Ugly double bottom after a yearly low
- 2016An unconfirmed stock double bottom next to a confirmed index
- 2016Constructing a range-midpoint moving average
- 2017Evaluating whole-dollar delays on pattern breakouts
- 2018Volume-confirmed bottoms and breakouts with moving averages
- 2018Evaluating double bottoms with a locked stochastic confirmation
- 2019Forex pairs as relative value: yield spreads, support, and a double bottom