2010issue C0338-43
Hourly pattern entries, exits, and abstention as one playbook
This case study treats familiar hourly chart structures as a written sequence rather than as names to trade on sight. A daily trend filter decides whether long setups in an inverse index vehicle are eligible. After a pattern has formed, entries, exits, and common-sense stops are placed around breaks, failed rallies, and confirmation-line tests.
- A higher-timeframe filter comes first: hourly long work in the inverse vehicle is allowed only while the cash index is below its 20-day simple moving average.
- Once a pattern has formed, the hourly chart is used to place entries, exits, and stops around breaks, failed rallies, gap pivots, and retests.
- Seven long-entry locations are written as one procedure, each paired with a common-sense stop just below that entry.
- Abstention belongs to the same rule-based entry: if the listed condition is missing, or if price is not holding a required average, the trade is not taken.
Hourly work after a pattern has formed
The case study frames short-term hourly tactics as a way to locate entry, exit, and stop placements after a chart pattern has already formed.
A higher-timeframe filter is specified first. A long in the inverse S&P 500 vehicle is allowed only while the cash index is below its 20-day simple moving average. Hourly pattern work is accepted or rejected by that daily condition before any entry is considered.
Breakdown, gap pivot, and a broken uptrend
On the hourly chart, a mid-June rising channel gave way to a descending triangle. Price then gapped through that triangle, a MACD bearish crossover appeared, and the market tested gap support near 56.50 where that shelf intersected a rising trendline.
A failed challenge of the last minor high just above 59 produced a lower high. A subsequent lower low that broke both horizontal and rising support is treated as an exit because the uptrend is broken.
SDS hourly closes, mid-June to 1 July 2009
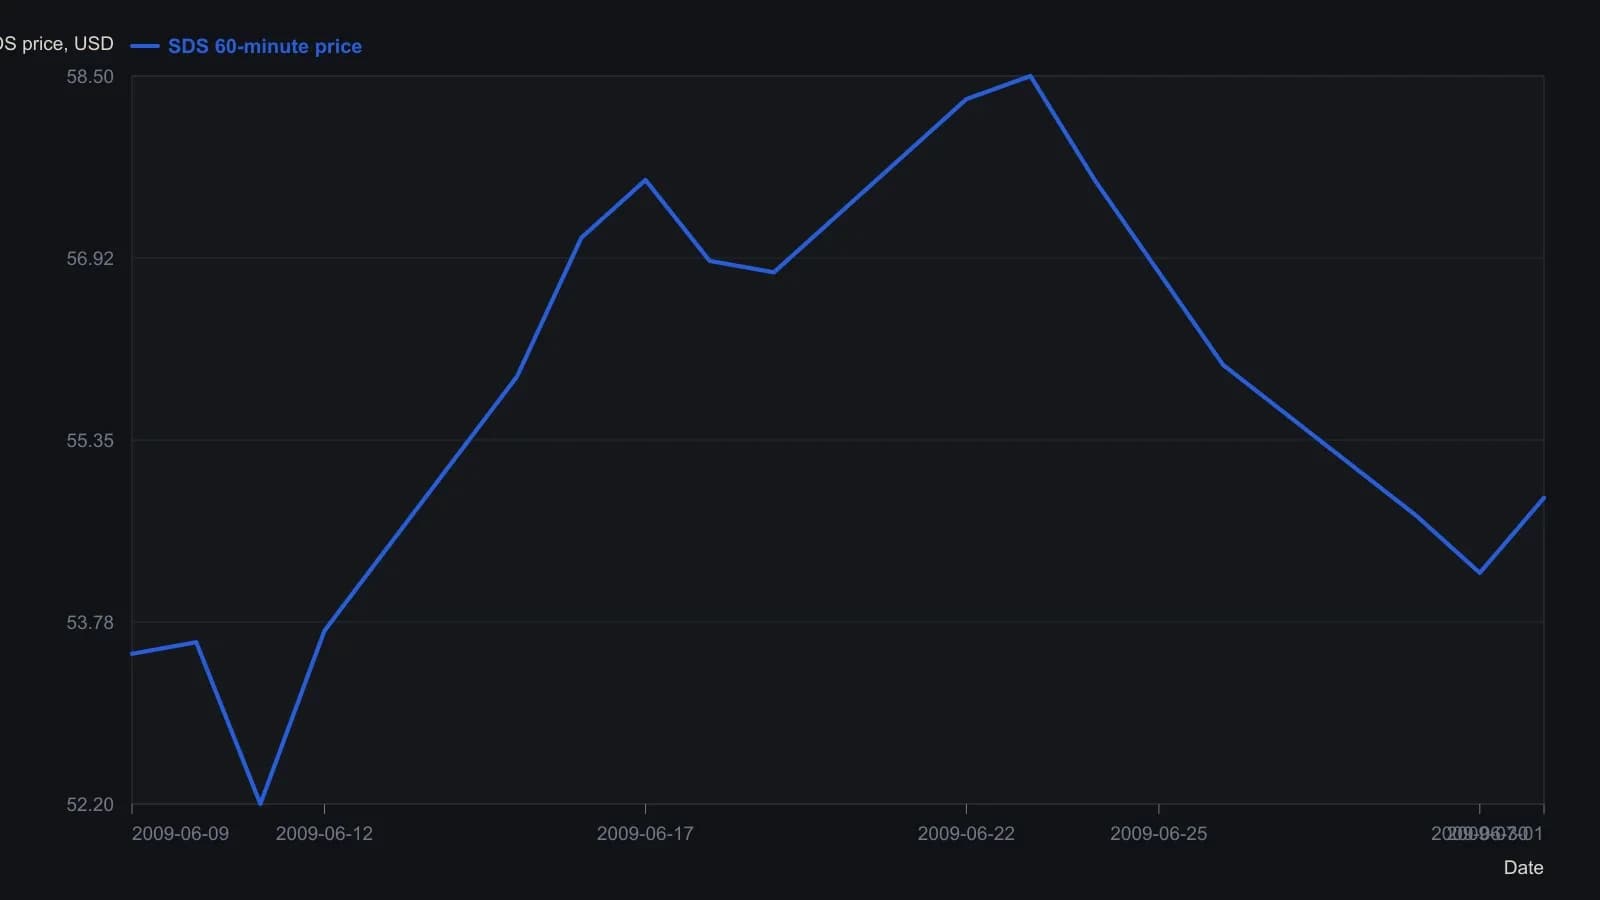
One representative print per session, read to the nearest tenth of a dollar except the 1 July close, which the quote window states as 54.85. The dotted path after 1 July is a drawn sketch of later entries, not traded prices, and was left off.
Falling wedge and a double-bottom hypothesis
A bullish falling wedge on June 29, 2009, broke upward the next session after a MACD-histogram bullish divergence. The advance then met resistance near 56 and later retested the wedge momentum low.
After a lower low with bullish MACD and 14-period RSI divergences, price thrust into a possible double bottom. The second-trough pivot is presented as a swing entry if that double bottom completes.
Seven long entries and the matching stops
Seven long-entry locations are enumerated as one procedure: a falling-wedge breakout, a double-bottom pivot, a gap pivot near 54.90, a channel breakout near 55.25, a break of the double-bottom confirmation line, a successful pattern retest, and a later push above the post-breakout peak.
Each tactical entry is paired with a common-sense stop placed just below the corresponding entry. Abstention is implicit when the listed condition is absent.
A written reason to stand aside
A rising-hourly support idea at the 50-period exponential moving average is withheld when price is not holding above that average. The same rule-based entry that lists where to enter also states when to stay out.
All readings on this track · 32 readings
- 1988Reaction length as a trend integrity test
- 1991Sold-out double bottoms as a three-gate inventory test
- 1991A breadth classifier for V-bottoms and W-bottoms
- 1991Precomputed price-ratio clusters and double-top tests
- 1992Bond turning points as a regime check on equity double tops and breakouts
- 1992Commodity-bond ratio as an equity regime overlay
- 1992Gold lead confirmation for commodity-index turns
- 1994Constructing the thousand-line advance-decline indicator
- 1995Evaluating zero-line patterns on a breadth-price oscillator
- 1996Constructing double tops from a resistance retest to a trough break
- 1996Four-stage double-bottom construction
- 1998Double-bottom confirmation and stop placement
- 2000Two-bar reversal construction
- 2001Constructing double tops from failed resistance retests
- 2002Eve-Eve double bottoms: width, confirmation, and overhead resistance
- 2002Constructing Eve-and-Eve and classic double bottoms
- 2003Eve-Adam double bottoms as a two-step classroom test
- 2003Shape contrast then breakout confirmation in Adam and Eve double bottoms
- 2003Reading cyclical bottoms inside secular bear regimes
- 2004A case study of the shark-attack Fibonacci retracement
- 2004Confirming index turns with envelopes, divergence, and breadth
- 2005A five-wave euro/dollar case and the support that still had to fail
- 2007Constructing commodity seasonal indexes for regime context
- 2009Constructing rounded and double-top short setups
- 2010Hourly pattern entries, exits, and abstention as one playbook
- 2016Ugly double bottom after a yearly low
- 2016An unconfirmed stock double bottom next to a confirmed index
- 2016Constructing a range-midpoint moving average
- 2017Evaluating whole-dollar delays on pattern breakouts
- 2018Volume-confirmed bottoms and breakouts with moving averages
- 2018Evaluating double bottoms with a locked stochastic confirmation
- 2019Forex pairs as relative value: yield spreads, support, and a double bottom