1999issue C091-5
Regime-aware stock exposure when rates and market condition agree
A one-sided equity forecast can miss the force that is actually in control. Classifying the rate backdrop and the market's own condition together isolates aligned, mixed, and opposed states and turns an isolated view into a weeks-to-months weight decision.
- A forecast that models only fundamentals or only price action can miss the unmodeled force when that force takes control of the market.
- Joint classification of fundamental and technical stance isolates aligned, mixed, and opposed states before a single equity position is sized.
- Subsequent returns were historically most differentiated in aligned cells of the strong-weak matrix and nearer the long-run average when the two forces conflicted.
- Inside each rate-quartile, an oversold-overbought-split further separated more favorable from less favorable subsequent-return cells.
Two axes, not one indicator
A one-sided forecast that models only fundamentals or only price action can miss the unmodeled force when that force takes control of the market.
Market-regime-classification sorts current conditions into jointly defined states so a single position can be sized against the prevailing backdrop rather than treated as an isolated forecast. Joint classification of current fundamental and technical stance is meant to isolate periods when those forces are aligned versus when they compete.
A four-cell map before the forecast
In a simple strong-or-weak matrix, above-average subsequent returns are expected when both forces are strong, below-average returns when both are weak, and near-average returns when the two forces conflict.
The strong-weak-matrix is a four-cell map of fundamental and technical stance that isolates aligned, mixed, and opposed regimes before any forecast is formed. An aligned-regime is a state in which the fundamental driver and the market's own condition point the same way, historically the most differentiated return environment. A mixed-regime is a state in which one force is supportive and the other is not, historically closer to the long-run average than to either extreme.
Rate change as a fundamental overlay
A 20-trading-day change in the 90-day Treasury-bill yield, ranked into four historical quartiles, was used as the fundamental overlay for subsequent 10-trading-day S&P 500 returns. A rate-quartile ranks recent Treasury-bill yield change into four equal historical groups, from the most rapid declines to the most rapid increases.
Fundamental-overlay uses a cross-market fundamental driver, such as recent interest-rate change, to decide whether equity exposure should be increased, reduced, or left near a baseline weight.
Across about 6,300 trading days ending 31 December 1998, subsequent annualized 10-day S&P 500 returns declined smoothly from 20.16% after the most rapid rate declines to -3.59% after the most rapid rate increases, versus 10.26% for all days. The share of positive 10-day S&P 500 outcomes fell from 63% in the most favorable rate quartile to 51% in the least favorable quartile, compared with 59% for all 10-day periods.
Subsequent stock-market volatility was larger than average after the most rapid rate moves in either direction.
An oversold-overbought split inside each rate regime
Adding an oversold-versus-overbought technical split inside each rate quartile raised the most favorable aligned cell to 26.90% and cut the same falling-rate regime to 11.80% when the market was overbought.
The least favorable aligned cell, rapidly rising rates plus an overbought market, produced -8.44%, while rapidly rising rates plus oversold conditions produced 1.64%.
Within each rate-change category, subsequent returns were higher when the market was oversold and lower when it was overbought, which also accounts for episodes when large rate moves appeared to have little market effect. The oversold-overbought-split is a technical partition of market condition that further separates each rate regime into a more favorable and a less favorable subsequent-return cell.
S&P 500 10-day payoff by T-bill quartile and TRIN state
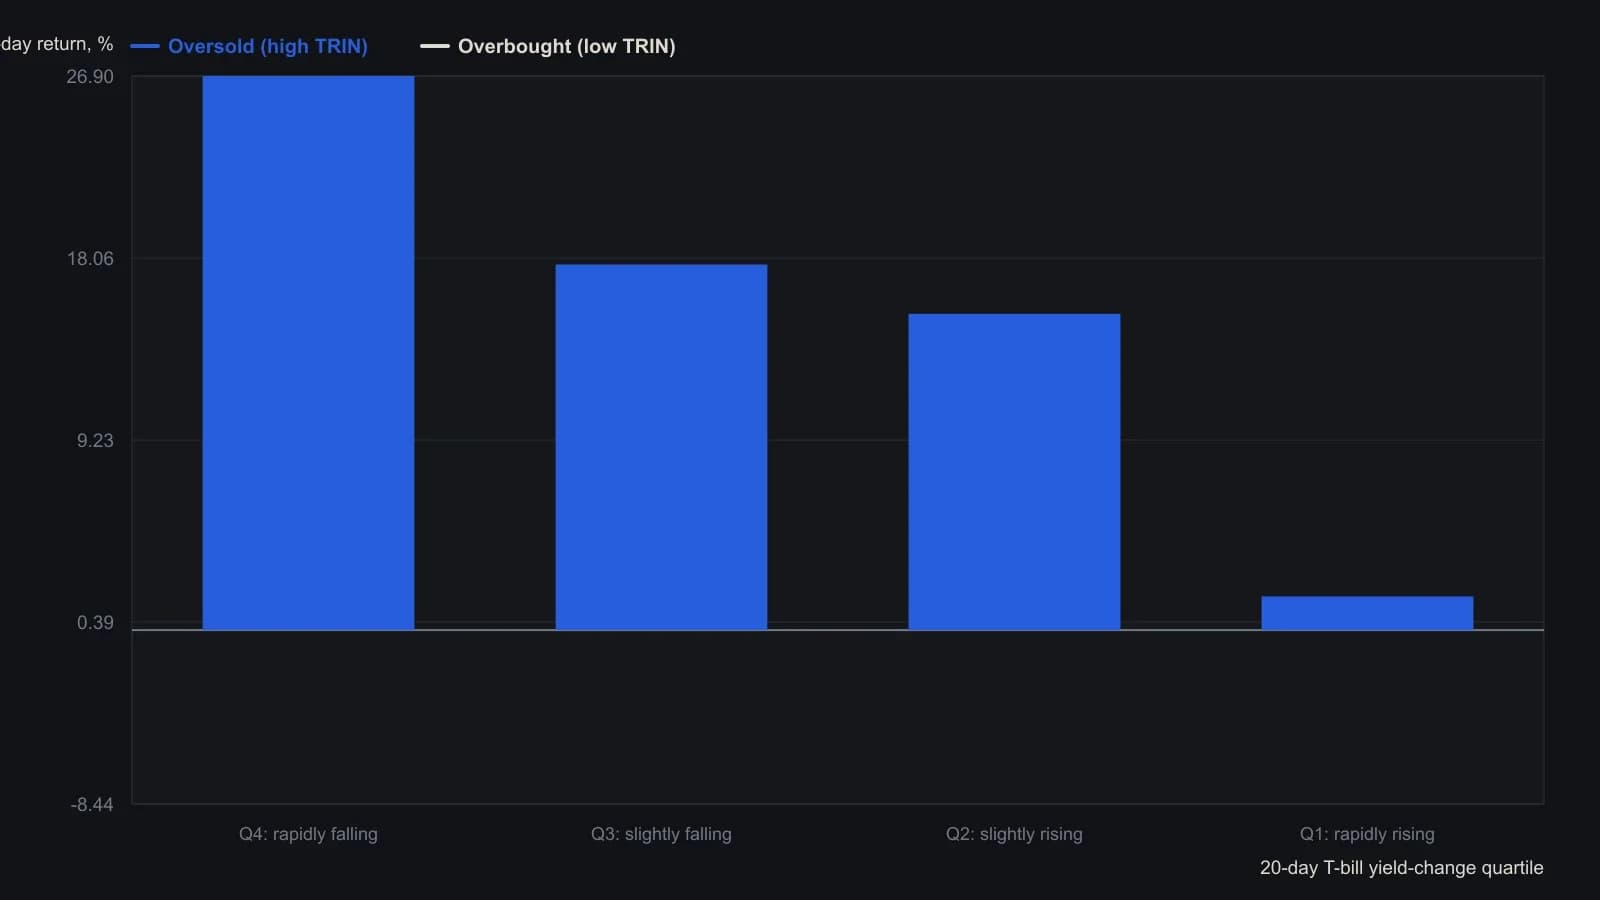
Rate state is the 20-day continuously compounded change in the 90-day Treasury bill yield, cut into quartiles. TRIN state is a 10-day NYSE TRIN average split at the historical median. Returns exclude dividends and are annualized by multiplying the 10-day change by 25.2.
From a single forecast to a weight
Seasonal-analysis reads recent multi-week rate and price-path conditions as a recurring market season that historically maps to above-average, average, or below-average subsequent returns.
Editorial interpretation: once the two axes are classified, the isolated equity view becomes a sizing question on a weeks-to-months horizon. Historically, aligned cells were the most differentiated subsequent-return environments. Mixed cells stayed nearer the long-run average, which is why a large rate move can appear to have little effect until the market's own condition is read on the second axis.
All readings on this track · 21 readings
- 1991Growth earnings and price-to-earnings as a market-regime overlay
- 1991Earnings-price reliability as a first gate for growth-sleeve construction
- 1991Growth-adjusted earnings years as construction filters
- 1992Constructing an index nominal from smoothed earnings and effective rates
- 1992Real bond yields as a deficit-share regime
- 1994Relative valuation as regime context for fund allocation
- 1995A flattening trendline as a critique of the fundamental overlay
- 1998An earnings-to-price mapping is unfinished until add, reduce, and stand-aside are rules
- 1999Regime-aware stock exposure when rates and market condition agree
- 2002Short-rate velocity regimes before tightening
- 2003A pre-trade checklist that requires rule and fundamental agreement
- 2004Evaluating P/E overlays with matched crossovers
- 2004Constructing a stock-versus-bond regime from earnings yields
- 2012Cash-rich relative strength as a pre-trade portfolio filter
- 2012Inactivity as a feature: a small-cap earnings overlay with a monthly average and weekly MACD
- 2015Evaluating a capitalization-to-output-ratio as a regime overlay
- 2016Risk-adjusted earnings yield as a portfolio overlay
- 2017Oil, yields, and implied volatility as a regime critique
- 2017When a one-year bull sits inside a secular bear
- 2018A critique of rules-only trading systems
- 2019When seasonal and policy regimes override crowd mood