1998issue C021-7
Double-bottom confirmation and stop placement
A double bottom is treated as confirmed only after price rises above the highest point between the two troughs. Until then the decline is still in force, and a stop just below the lowest trough is used so a failed reversal stays bounded.
- A double bottom is confirmed only after price rises above the highest point between the two troughs following the second low.
- Without that confirmation, the decline is treated as still in force rather than reversed.
- A measure-rule target is formed by adding the height from the lowest trough to the confirmation point back onto that same point.
- A stop is placed just below the lowest trough, or just below a closer support, so a failed reversal or a regrouping into a triple bottom does not become an unbounded hold.
Confirmation comes after the second low
A double bottom is a potential bullish reversal after a decline, formed by two troughs at similar prices with a rise between them. In this archive workflow, that shape is treated as confirmed only after price rises above the highest point between the two troughs following the second low.
That intervening high is the confirmation point. The pattern is not confirmed until price later exceeds this level. Without that confirmation, the decline is treated as still in force rather than reversed.
How the archive selected the structure
The source selection model required at least two weeks between troughs, no more than 4% price variation from trough to trough, and at least a 10% rise between bottoms that does not undercut the lowest low.
A height-based minimum objective
A minimum upside objective is formed by adding the distance from the lowest trough to the confirmation point back onto the confirmation point. That objective is the measure-rule target.
In the source sample, that objective was reached 74% of the time, the average post-confirmation advance was 45%, and 8% of formations failed to reverse the decline.
Ultimate rise after double bottoms by trough spacing
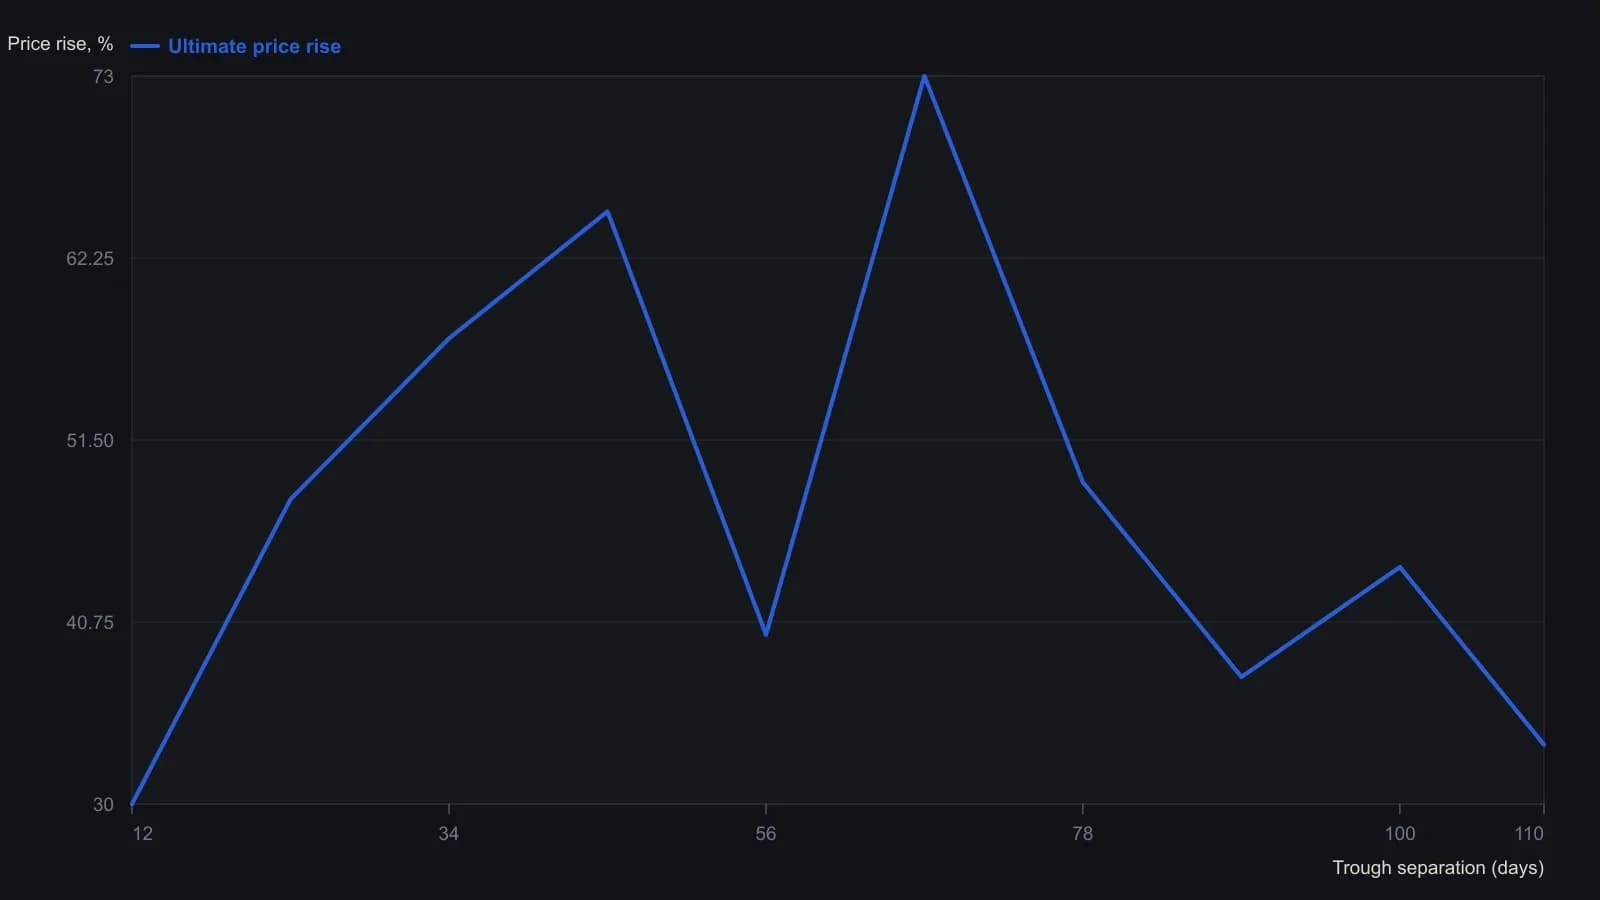
The source split trough-to-trough duration into ten bins; two bins held only four and five formations, so the ends of the curve rest on thin samples. Bottoms as close as two weeks were allowed, versus the classic one-month floor.
Support, resistance, and a bounded stop
Before entry, support and resistance are used to compare downside risk to a nearby support against upside room to the next resistance, with a 1:4 risk-to-reward ratio cited as a planning check. Those prior price levels size how far a failed setup might fall versus how far a confirmed advance might stall.
A stop is placed 3/16 below the lowest trough, or 1/8 to 3/16 below a closer support if that full loss is unacceptable, so a regrouping into a triple bottom does not become an unbounded hold. The stop-loss is a pre-placed exit so a failed reversal stays bounded.
All readings on this track · 32 readings
- 1988Reaction length as a trend integrity test
- 1991Sold-out double bottoms as a three-gate inventory test
- 1991A breadth classifier for V-bottoms and W-bottoms
- 1991Precomputed price-ratio clusters and double-top tests
- 1992Bond turning points as a regime check on equity double tops and breakouts
- 1992Commodity-bond ratio as an equity regime overlay
- 1992Gold lead confirmation for commodity-index turns
- 1994Constructing the thousand-line advance-decline indicator
- 1995Evaluating zero-line patterns on a breadth-price oscillator
- 1996Constructing double tops from a resistance retest to a trough break
- 1996Four-stage double-bottom construction
- 1998Double-bottom confirmation and stop placement
- 2000Two-bar reversal construction
- 2001Constructing double tops from failed resistance retests
- 2002Eve-Eve double bottoms: width, confirmation, and overhead resistance
- 2002Constructing Eve-and-Eve and classic double bottoms
- 2003Eve-Adam double bottoms as a two-step classroom test
- 2003Shape contrast then breakout confirmation in Adam and Eve double bottoms
- 2003Reading cyclical bottoms inside secular bear regimes
- 2004A case study of the shark-attack Fibonacci retracement
- 2004Confirming index turns with envelopes, divergence, and breadth
- 2005A five-wave euro/dollar case and the support that still had to fail
- 2007Constructing commodity seasonal indexes for regime context
- 2009Constructing rounded and double-top short setups
- 2010Hourly pattern entries, exits, and abstention as one playbook
- 2016Ugly double bottom after a yearly low
- 2016An unconfirmed stock double bottom next to a confirmed index
- 2016Constructing a range-midpoint moving average
- 2017Evaluating whole-dollar delays on pattern breakouts
- 2018Volume-confirmed bottoms and breakouts with moving averages
- 2018Evaluating double bottoms with a locked stochastic confirmation
- 2019Forex pairs as relative value: yield spreads, support, and a double bottom