1999issue C041-11
Compound pivots and market symmetry
Related indices can post the extreme of the same market move on different days. Archive cases treat those outside pivots, plus the balance point exactly between them, as one compound pivot used to test later day counts against a two-day error margin.
- A compound pivot is two outside turning days from related series that share one move, plus the balance point located exactly between those days.
- Related indices can mark the same move on different days; both extremes must be kept, and all three points may be used when a later day count is measured.
- A repeated count qualifies as symmetry only inside a two-day error margin, so a six-day gap does not qualify.
- A projected window is a nonevent unless the indices make new extremes in that window, and the window may later be only a balance point.
What a compound pivot is
A compound pivot is the set of two outside turning days from related series that share one market move, plus the balance point located exactly between those days. Related indices can post the extreme tick of the same move on different days. Both days must be retained for measurement.
Outside pivots of one compound pivot can be as little as three days apart or more than 500 days apart, as long as both days belong to the same shared move.
Day counts that define the 1966–1968 compound pivot
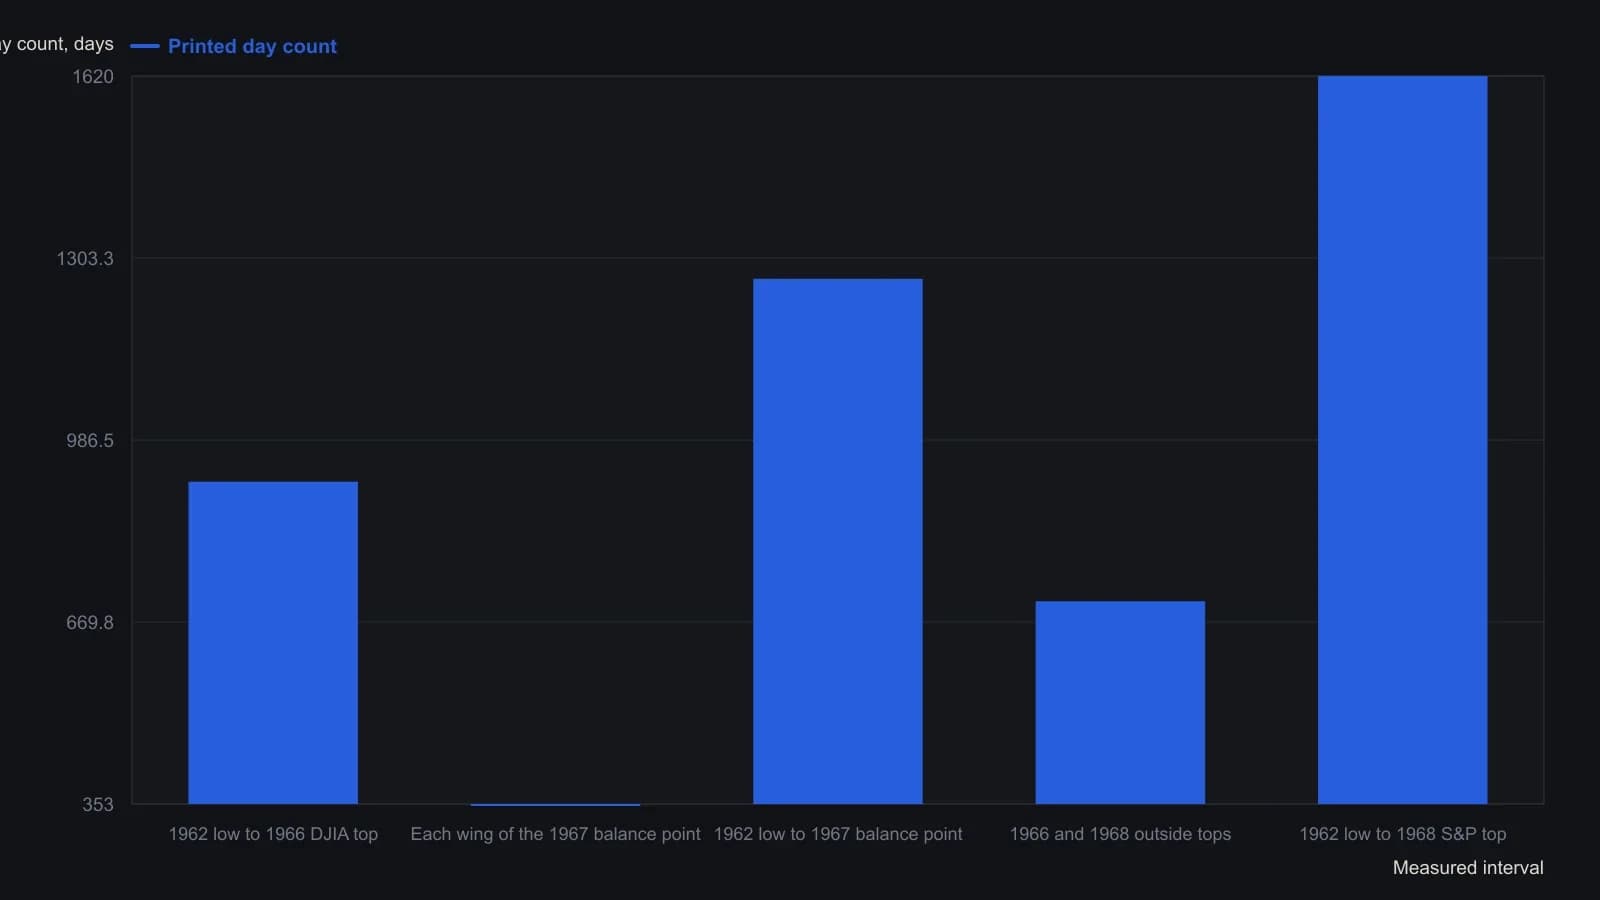
Ermanometry allows at most a two-day miss on any count, no matter how long the leg.
Cases that keep both outside dates
The 1966 DJIA top and the 1968 S&P 500 top, 706 days apart, form the outside pivots of a large compound pivot whose 1967 balance point is used in later day-count comparisons.
The 1974 extreme intraday lows of the S&P 500 and the DJIA fell 45 trading days apart, on October 4 and December 9, and define another compound pivot with its own balance point.
In late 1994 the DJIA low on November 23 and the S&P 500 low on December 9, 11 days apart, form a compound pivot after both series had already made major lows on April 4.
The 1982 low is treated as a three-day compound pivot spanning August 9 and August 12, which is why counts from that low can differ by a few days.
Using all three points in a count
All three points of a compound pivot, both outside pivots and the balance point, must be used when searching for day-count symmetry or projecting a later turn. The mix-and-match rule allows any of those three points to serve as a timing origin or a destination.
The method allows a maximum mismatch of two days for a repeated count to qualify as symmetry. A six-day gap between a 1,267-day 1962 to 1967 span and a 1,273-day 1982 to 1987 span does not qualify under that two-day error margin.
When a projected window is a nonevent
A projected window is treated as a nonevent unless the indices make new extremes in that window. Under the nonevent rule, the window itself may turn out to be only the balance point of a later compound pivot.
All readings on this track · 12 readings
- 1988Four sugar-futures turns as a ranked wave-ratio audit
- 1989Cluster-first construction of change-in-trend days from two ratio families
- 1992Wheat bull leg from a squared counterswing and Gann angles
- 1999Log-spiral wave construction from seed pivots
- 1999Compound pivots and market symmetry
- 1999Squaring charts for Gann angles
- 2007Constructing Gann time-price squares, angles, and 144 grids
- 2010Constructing Gann angles to square price and time
- 2011How a Lucas time series is built onto an Elliott wave map
- 2013Time-price boxes for wave-four construction
- 2016Gann circle eighths, Fibonacci neighbors, and time-price squares
- 2016Constructing wave cycles, Fibonacci spans, and time-price squares