2020issue C1026-31
Couple the slow period to stop-loss and trailing-stop settings
A moving-average crossover is often run with a fixed slow period and fixed exits. This archive article treats the slow period, stop-loss, and trailing stop as one environment-dependent set, chosen from how crossover segments change with volatility and trend.
- A moving-average crossover is often started when a short-period average or the close crosses a longer-period average, while the slow period is commonly left fixed at a default such as 200 days.
- The slow period that tests best changes with volatility and with whether the market is trending or ranging, and some ranging stretches produce poor results for every slow period because price keeps crossing the slow average.
- Crossover segments can be scored by overshoot, undershoot, length, and return. Average segment length follows a scaling law in the slow period and in volatility, but volatility alone does not explain crossover profit without a trend measure.
- If the slow period is chosen from current trend and volatility, the stop-loss, take-profit, and trailing-stop settings should be resized with the same measurements, using trade-performance measures such as the slow period at peak profit factor.
A crossover starts a segment
A moving-average crossover trade is often started when a short-period average or the close crosses above or below a longer-period average. That cross is a signal. It opens a segment of bars that lasts until the next opposite cross.
The slow period is the lookback length of the slower average. It is commonly held fixed, and a 200-day length is cited as a typical default. A fixed length treats the chart condition as if the scale of the market never changed.
What a segment can record
Each crossover pattern is split into cross-up and cross-down segments. A segment is all bars between successive opposite crosses.
A segment can be described by price overshoot, bars to overshoot, price undershoot, bars to undershoot, segment length, and segment return. Those descriptive measures are the raw material for choosing a working slow period.
Trade evaluation of a segment also depends on execution inputs such as stop-loss and take-profit limits. Scores such as average profit and profit factor are used as trade-performance measures, and the slow period at the peak profit factor is treated as the usual best choice.
The best slow period is not stable
The slow period that tests best is described as changing over time with volatility and with whether the market is trending or ranging. Some stretches produce poor results for every slow period because price repeatedly crosses a slow average in a range.
Average segment length is reported to scale with the slow period and also to show long-term month-to-month variation. A single conventional value, including a 200-day default, cannot stay aligned with both of those movements.
Average MAC segment length by month on EURUSD H1
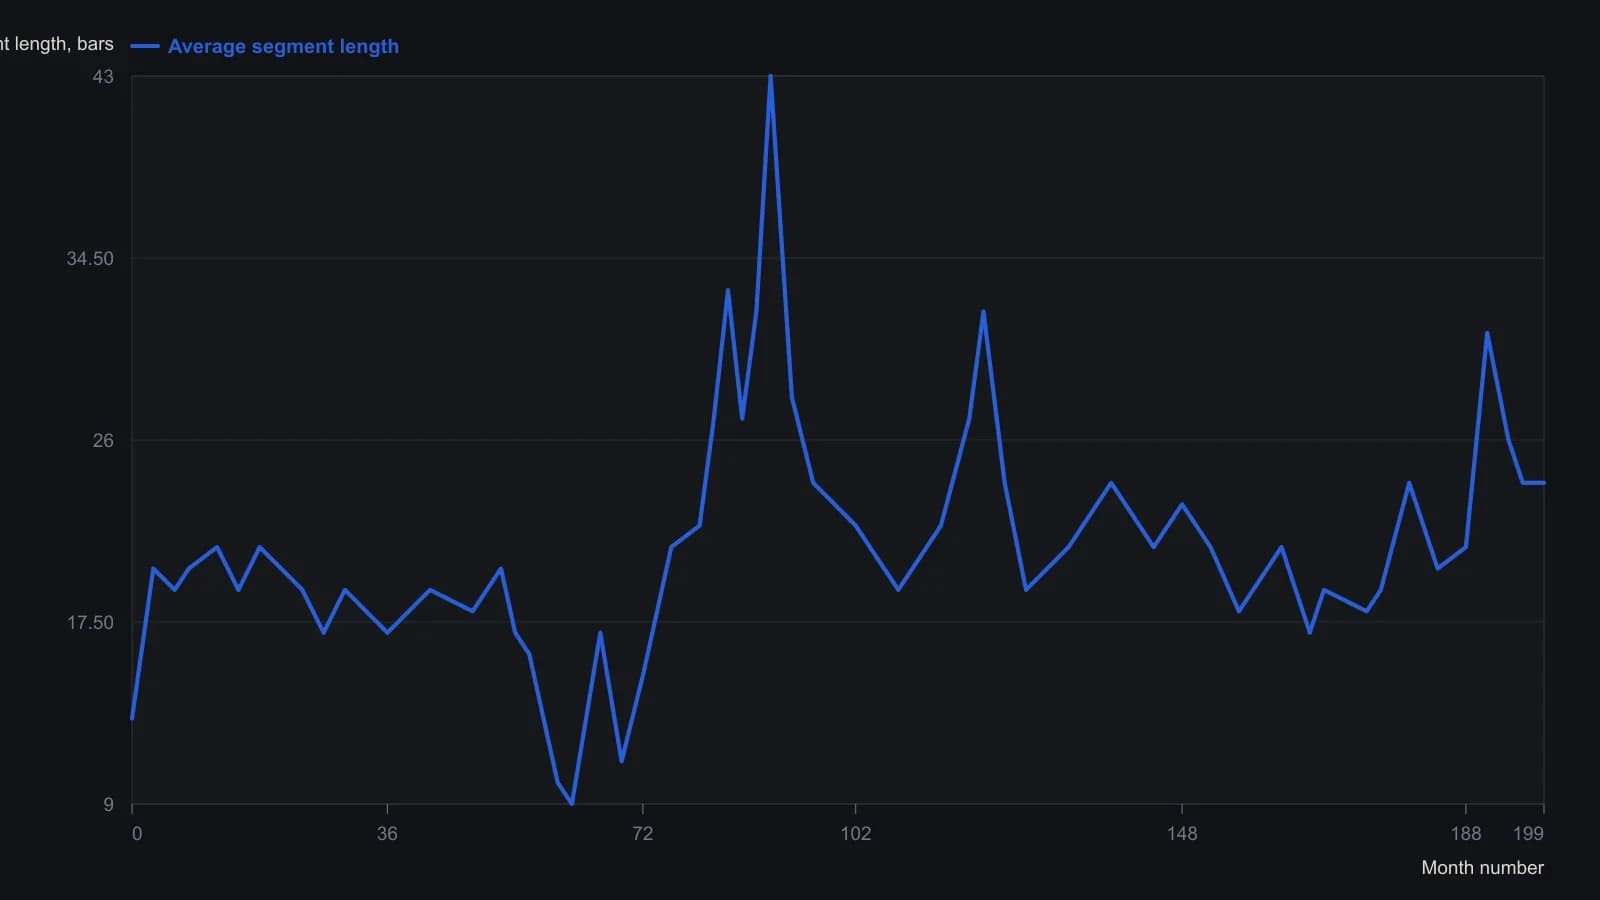
Slow simple moving average fixed at 85 bars; monthly averages smoothed with a 5-month window. Values are read from the plotted curve, not a table, so turning points are approximate to about one bar.
Volatility and trend are joint inputs
The archive analysis uses hourly EURUSD from 2004 through 2020. There, volatility is defined as the average absolute close-minus-open of each bar and is shown to have long-term time variation.
Segment statistics are treated as depending on fast and slow periods, average type, volatility readings such as ATR or band width, and trend readings such as ADX, RSI, a stochastic oscillator, trend correlation, or SMA slope.
Volatility alone is said not to explain crossover profit, so at least one trend measure is required as well. A dynamic optimal slow period is a slow-average length chosen from current trend and volatility readings instead of a single conventional value such as 200 days.
Scaling laws tie period, volatility, and exits
Average segment length is described as scaling with volatility as the observation scale, following a power-law form in which the log of the average descriptive measure is linear in the log of the scale input. That regular relationship is a scaling law: an average segment statistic changes as a power of an input such as volatility or slow period, so those averages can be predicted from the current scale.
The analysis concludes that pairing a dynamic slow period with dynamic stop-loss, take-profit, or trailing-stop settings outperforms fixed-parameter versions. If the slow average is made dynamic, the stop and target should be made dynamic as well, using scaling laws and both trend and volatility to choose the period from segment-based performance measures.
A stop-loss is a pre-set loss bound placed before or during a trade so the downside of a crossover segment is limited rather than left open. A trailing stop moves with favorable price so remaining risk stays bounded after a crossover entry has already moved in the trade's favor.
All readings on this track · 36 readings
- 1988Half-day bars, a midpoint gate, and a bar-based trail
- 1989Packaging two-bar reversals into testable entry and exit rules
- 1989Weekly high and low averages as stop-and-reverse levels
- 1991Constant false-alarm rate for dominant-cycle stops
- 1992Tick-index extremes as continuation and turn hypotheses
- 1993Constructing layered stops from equity and structure
- 1993Filter crossovers with moving-average slope
- 1993Precommit stop bounds from equity and structure
- 1998Evaluating a trendline barrier that can only tighten a capped stop
- 1999Constructing common-number support and resistance
- 2001Four-step opening-hour bias and trailing stops
- 2004Make the trading system the star
- 2005A beginner stock case: stop, trail, and the pre-trade checklist
- 2006Sell stops that trail support after the buy
- 2006Treat a wave-3 label as unfunded until the stop rails are written
- 2008Test medium-term divergence with a trendline break and a trailing stop
- 2010Rule-based forex entry, stop and trail
- 2012Precommitting stops when one currency range templates another
- 2012Cat-ears as a downtrend continuation hypothesis
- 2013Three-average swing entry and a trailing average exit
- 2014Construct a dual quotient-copy trend filter under a frequency roof
- 2014Stop distance, size, and trailing swing invalidation
- 2014Long-only RSI pullback, reversal-bar-entry, and staged-trail construction
- 2015Dual-average regime, trigger candle, and trail as one daily script
- 2015Three-gate trend system: filter, trigger, and trailing stop
- 2016Construct HHLLS crossover and breakout entry rules
- 2017An appointment-trade around a scheduled political close
- 2017Golden-cross breakout rules for a swing entry
- 2017Breakout confirmation above round numbers, with nines as sell shelves
- 2018Classify diamond geometry before the breakout
- 2019When trails and stops betray the support read
- 2019One-triggers-the-other pairs for preplanned swing entries
- 2019One-triggers-the-other orders for a breakout and its stop
- 2019When the second decision unbounds planned risk
- 2020Last-Hour Breakout With a Same-Session Flatten
- 2020Couple the slow period to stop-loss and trailing-stop settings