2018issue C1130-33
Classify diamond geometry before the breakout
A diamond is a rhombus built from a broadening triangle followed immediately by a regular triangle. Its internal swing geometry, not a generic pattern label, shows whether the next breakout can be projected or must stay two-way. Classify the rhombus as single-diagonal or two-diagonal first, then choose a confirmation stop or an earlier diagonal stop.
- A diamond can resolve as continuation or reversal. The rhombus shape and its internal swings, not a generic pattern label, indicate which role applies.
- In a single-diagonal diamond the longest swing joins the pattern top and bottom, the described breakout is opposite that main diagonal, and the next move can be projected before the formation is complete.
- In a two-diagonal diamond the two successive main diagonals are of similar size, so the breakout can occur in either direction and cannot always be projected from the geometry alone.
- Set the geometry class before choosing a wait-for-breakout stop or an earlier single-diagonal stop. After the breakout, height-based measured objectives and trailing stops are weaker tools.
Shape first, then the label
A diamond can resolve as either a continuation or a reversal. The formation's shape, not a generic pattern label, indicates which role applies.
A diamond is a rhombus-shaped price structure formed by a broadening triangle immediately followed by a regular triangle. Those two triangles do not have to be symmetrical.
Single-diagonal or two-diagonal
Diamonds can be grouped as single-diagonal or two-diagonal according to the sequence and relative length of the swings inside the rhombus.
In a single-diagonal diamond the longest swing joins the pattern top and bottom, and the other swings are substantially shorter. The described breakout is opposite that main diagonal. The next move can be projected before the formation is complete.
In a two-diagonal diamond the two successive main diagonals are of similar size. The eventual breakout can occur in either direction, so the next move cannot always be projected from the geometry alone. The breakout is the price move that leaves the completed diamond's borders.
Lookalikes and timeframe
A straight two-diagonal diamond can be mistaken for a head-and-shoulders. An identifiable broadening triangle on the left side of the formation is the distinguishing clue.
Diamonds can form on any timeframe and in any market. On weekly and monthly charts they are described as often setting the following medium- to longer-term direction.
Dow Jones weekly path through the 2014–2016 single-diagonal diamond
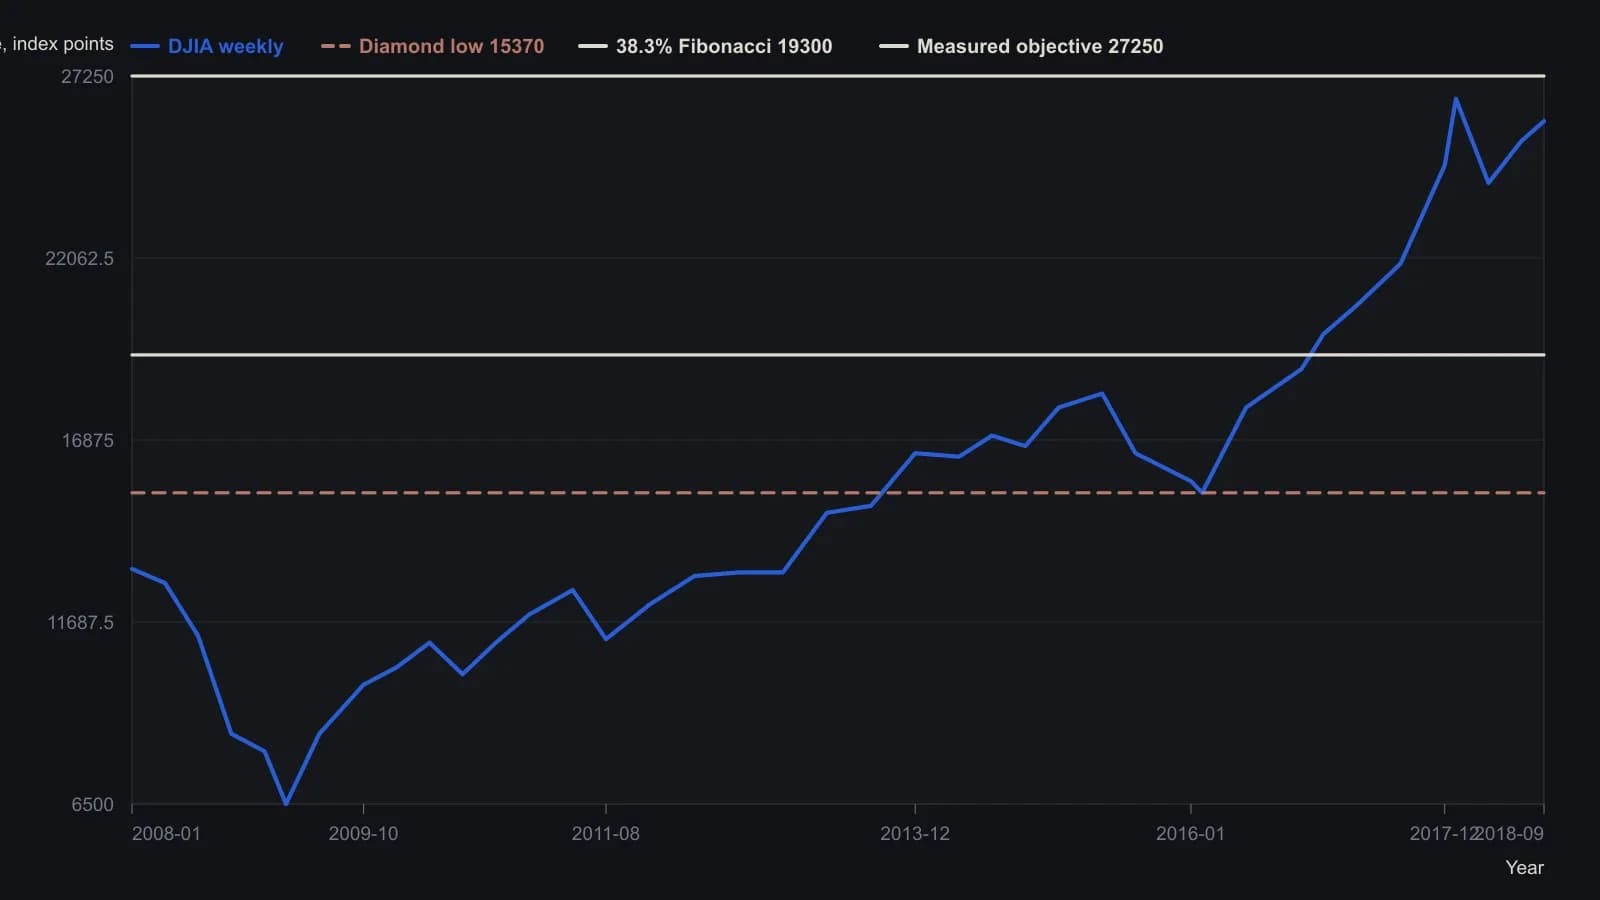
Candles are weekly; sampled at roughly quarterly spacing so the digitized series stays within 60 points. Y values are approximate to the nearest 50–100 index points except where the chart header or the article states an exact print.
Choose the stop after the class
A conservative plan waits for the breakout and places a stop beyond the extreme of the last minor diagonal.
A single-diagonal alternative enters earlier near the next diagonal's extreme, with a stop beyond the main diagonal.
Editorial: choose between those two stop plans only after the rhombus has been classed. In the two-diagonal case, breakout direction stays two-way until price leaves the completed borders.
Weaker tools after the breakout
After a diamond breakout there is no reliable height-based measured objective. A measured objective is a height-from-breakout profit projection commonly applied to other chart patterns. Diamonds are described as lacking a reliable version of this target.
A trailing stop follows price after entry. In diamond trades it is a weaker bounding tool because post-breakout travel is not well described by the pattern height. Trailing stops are described as less dependable here than they are for many other patterns.
Editorial: treat trailing stops and height-measured targets as secondary tools, not as the reason to take the trade.
All readings on this track · 36 readings
- 1988Half-day bars, a midpoint gate, and a bar-based trail
- 1989Packaging two-bar reversals into testable entry and exit rules
- 1989Weekly high and low averages as stop-and-reverse levels
- 1991Constant false-alarm rate for dominant-cycle stops
- 1992Tick-index extremes as continuation and turn hypotheses
- 1993Constructing layered stops from equity and structure
- 1993Filter crossovers with moving-average slope
- 1993Precommit stop bounds from equity and structure
- 1998Evaluating a trendline barrier that can only tighten a capped stop
- 1999Constructing common-number support and resistance
- 2001Four-step opening-hour bias and trailing stops
- 2004Make the trading system the star
- 2005A beginner stock case: stop, trail, and the pre-trade checklist
- 2006Sell stops that trail support after the buy
- 2006Treat a wave-3 label as unfunded until the stop rails are written
- 2008Test medium-term divergence with a trendline break and a trailing stop
- 2010Rule-based forex entry, stop and trail
- 2012Precommitting stops when one currency range templates another
- 2012Cat-ears as a downtrend continuation hypothesis
- 2013Three-average swing entry and a trailing average exit
- 2014Construct a dual quotient-copy trend filter under a frequency roof
- 2014Stop distance, size, and trailing swing invalidation
- 2014Long-only RSI pullback, reversal-bar-entry, and staged-trail construction
- 2015Dual-average regime, trigger candle, and trail as one daily script
- 2015Three-gate trend system: filter, trigger, and trailing stop
- 2016Construct HHLLS crossover and breakout entry rules
- 2017An appointment-trade around a scheduled political close
- 2017Golden-cross breakout rules for a swing entry
- 2017Breakout confirmation above round numbers, with nines as sell shelves
- 2018Classify diamond geometry before the breakout
- 2019When trails and stops betray the support read
- 2019One-triggers-the-other pairs for preplanned swing entries
- 2019One-triggers-the-other orders for a breakout and its stop
- 2019When the second decision unbounds planned risk
- 2020Last-Hour Breakout With a Same-Session Flatten
- 2020Couple the slow period to stop-loss and trailing-stop settings