2012issue C1239-45
Cat-ears as a downtrend continuation hypothesis
The cat-ears formation is a six-phase downtrend continuation built around two failed spikes and a scalp-line break. After the break, the next decline is sized from the ear-to-scalp drop, then the stop is trailed to a 61.8% Fibonacci retracement of the new leg.
- Cat-ears is a six-phase downtrend continuation: a severe decline, an optional pause, two failed upward spikes around a narrow scalp, then a break of the scalp-line.
- After a scalp-line break, the minimum next decline is the same percentage as the ear-to-scalp drop.
- Higher volume on the right ear is framed as late buying near recent highs, not as a bullish override.
- After the next decline completes, the stop is trailed to a 61.8% Fibonacci retracement of that new leg; a deeper retracement is treated as evidence that the trend direction is changing.
The six-phase shape
The cat-ears formation is described as a six-phase downtrend continuation. The sequence is a severe decline, an optional pause, a left-ear spike and fade, scalp congestion, a right-ear spike and fade, then a break of the scalp-line.
The scalp-line is the support line drawn through the lows of the mid-pattern congestion between the two ears. Its break is the continuation trigger.
The scalp's horizontal congestion can look like strong support, which is why the completed right ear is treated as a deceptive pause rather than a confirmed base.
Usual variants
Usual variants keep the same bearish implication. The phase-2 pause may be missing. The ears may be unequal in height. The scalp-line may sit slightly above or below the phase-2 lows. The pause may also be long and volatile and look like a bottom before the last failed bounce.
Volume while the pattern builds
Volume is typically subdued while the pattern builds, with brief expansions at the start and end of the pause, at the ear tops, and at the left-ear low. A scalp-line break may print a volume spike, while later tests of that line usually occur on low volume.
Higher volume on the right ear is not treated as a bullish override. It is framed as late buying near recent highs just before a possible scalp-line failure.
The next-leg projection
After a scalp-line break, the minimum next decline is the same percentage as the ear-to-scalp drop. In the $10-to-$8 example, that percentage is 20% and the projection is at least another 20% from $8.
The pattern is said to last about 10 to 60 days, which places it mainly in a swing-trading horizon. A conservative rule is not to start new longs once the right ear has completed.
Trailing after the new decline
Once a trending leg has completed and the larger trend has resumed, the stop is trailed to a 61.8% Fibonacci retracement of that new leg.
The same trailing-stop framework can be applied on shorter time frames, but reliability is expected to decline. An extra rule is to tighten the stop after larger five-wave Elliott structures finish.
A retracement of more than 61.8% of a trending move is treated as evidence that the trend direction is changing.
MYTIL daily closes through the cat-ears scalp-line break
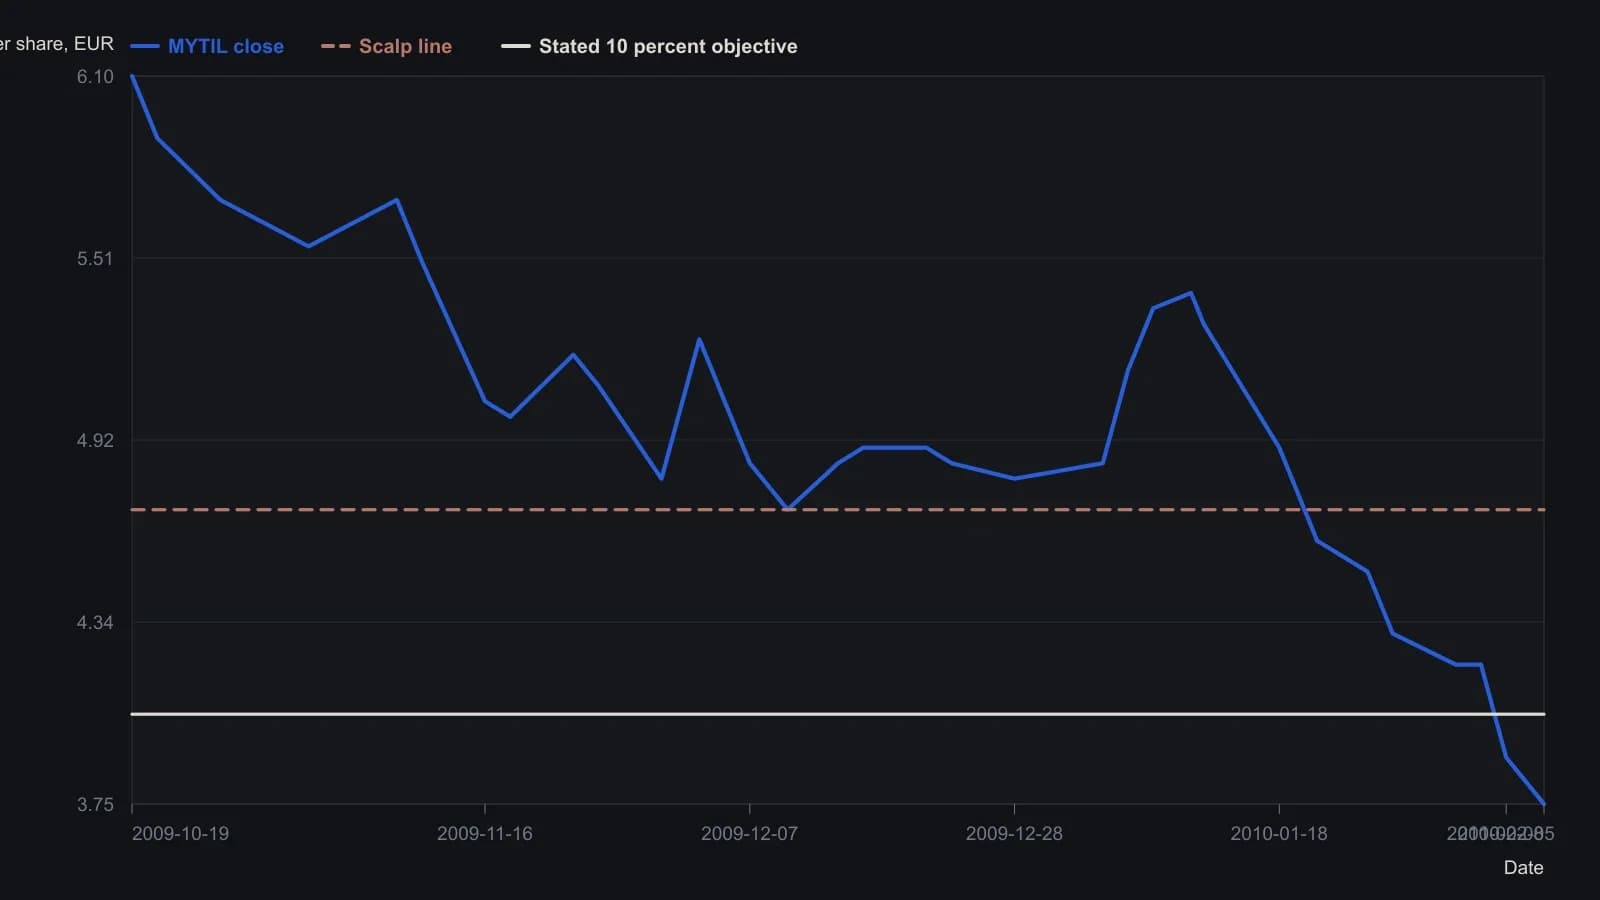
Siligardos timed this example at 35 trading days from late November 2009 and measured the next-leg objective from the left ear. Digitized closes are shown to the nearest 0.05 euro. Volume spikes marked on the source chart are not plotted here.
All readings on this track · 36 readings
- 1988Half-day bars, a midpoint gate, and a bar-based trail
- 1989Packaging two-bar reversals into testable entry and exit rules
- 1989Weekly high and low averages as stop-and-reverse levels
- 1991Constant false-alarm rate for dominant-cycle stops
- 1992Tick-index extremes as continuation and turn hypotheses
- 1993Constructing layered stops from equity and structure
- 1993Filter crossovers with moving-average slope
- 1993Precommit stop bounds from equity and structure
- 1998Evaluating a trendline barrier that can only tighten a capped stop
- 1999Constructing common-number support and resistance
- 2001Four-step opening-hour bias and trailing stops
- 2004Make the trading system the star
- 2005A beginner stock case: stop, trail, and the pre-trade checklist
- 2006Sell stops that trail support after the buy
- 2006Treat a wave-3 label as unfunded until the stop rails are written
- 2008Test medium-term divergence with a trendline break and a trailing stop
- 2010Rule-based forex entry, stop and trail
- 2012Precommitting stops when one currency range templates another
- 2012Cat-ears as a downtrend continuation hypothesis
- 2013Three-average swing entry and a trailing average exit
- 2014Construct a dual quotient-copy trend filter under a frequency roof
- 2014Stop distance, size, and trailing swing invalidation
- 2014Long-only RSI pullback, reversal-bar-entry, and staged-trail construction
- 2015Dual-average regime, trigger candle, and trail as one daily script
- 2015Three-gate trend system: filter, trigger, and trailing stop
- 2016Construct HHLLS crossover and breakout entry rules
- 2017An appointment-trade around a scheduled political close
- 2017Golden-cross breakout rules for a swing entry
- 2017Breakout confirmation above round numbers, with nines as sell shelves
- 2018Classify diamond geometry before the breakout
- 2019When trails and stops betray the support read
- 2019One-triggers-the-other pairs for preplanned swing entries
- 2019One-triggers-the-other orders for a breakout and its stop
- 2019When the second decision unbounds planned risk
- 2020Last-Hour Breakout With a Same-Session Flatten
- 2020Couple the slow period to stop-loss and trailing-stop settings