1999issue C071-4
Constructing common-number support and resistance
Support and resistance are constructed by marking levels on several participant time frames and keeping only the shared prices, called common numbers. The historical workflow then places a stop-loss a few ticks beyond the active number and advances a trailing stop toward the next number.
- Support is a temporary fair-value price where buying can halt a decline; resistance is the matching area where selling can halt a rally.
- Static grids, drawn trendlines, and moving averages are treated as unreliable because they do not update with changing economic pressure.
- Common numbers are the support and resistance prices that recur across the selected time-frame segments.
- A stop-loss sits a few ticks beyond the active common number, and a trailing stop advances toward the next number as the first objective.
Support and resistance as temporary fair value
Support is constructed as a temporary fair-value price where buyers can absorb selling and halt a decline. Resistance is the matching area where sellers can absorb buying and halt a rally. The paired support-resistance map is built so a repeatable chart condition can be turned into a testable entry, invalidation, and target.
Why static constructions are treated as unreliable
Constructions that treat the market as static and linear are treated as unreliable. Fixed-ratio grids, drawn trendlines, moving averages, and similar fixed-interval inputs do not update with changing economic pressure on price.
Building common numbers from time-frame segments
The construction procedure segments participants by chart time frame. Each selected interval is a time-frame segment that stands in for one group of participants. Support and resistance are marked on each selected interval. Only the shared prices are kept. Those shared prices are called common numbers.
Choosing time-frame segments
Time-frame choice is market-specific. A venue dominated by daytraders can be represented with intraday bars. Other markets require testing to find intervals that fairly represent their participants.
For the S&P 500, a participant set of 1-, 10-, 30-, and 45-minute charts plus the daily chart was used. A 10-minute chart was treated as already containing the patterns of nearby 5-, 7-, and 15-minute traders.
The count of common numbers that matter depends on a market's internal dynamics. For S&P daytrading the map was typically four prices.
One common number across several charts
In the March 1999 S&P 500 futures example, one common-number line acted as repeated support and resistance on the 1-minute chart. On the 10-minute chart it was prior resistance that failed on 6 January. It was a key level on the 30-minute chart, and it was the boundary of a four-day range on the daily chart after that breakout.
Daily March 1999 S&P range around the 1261 common number
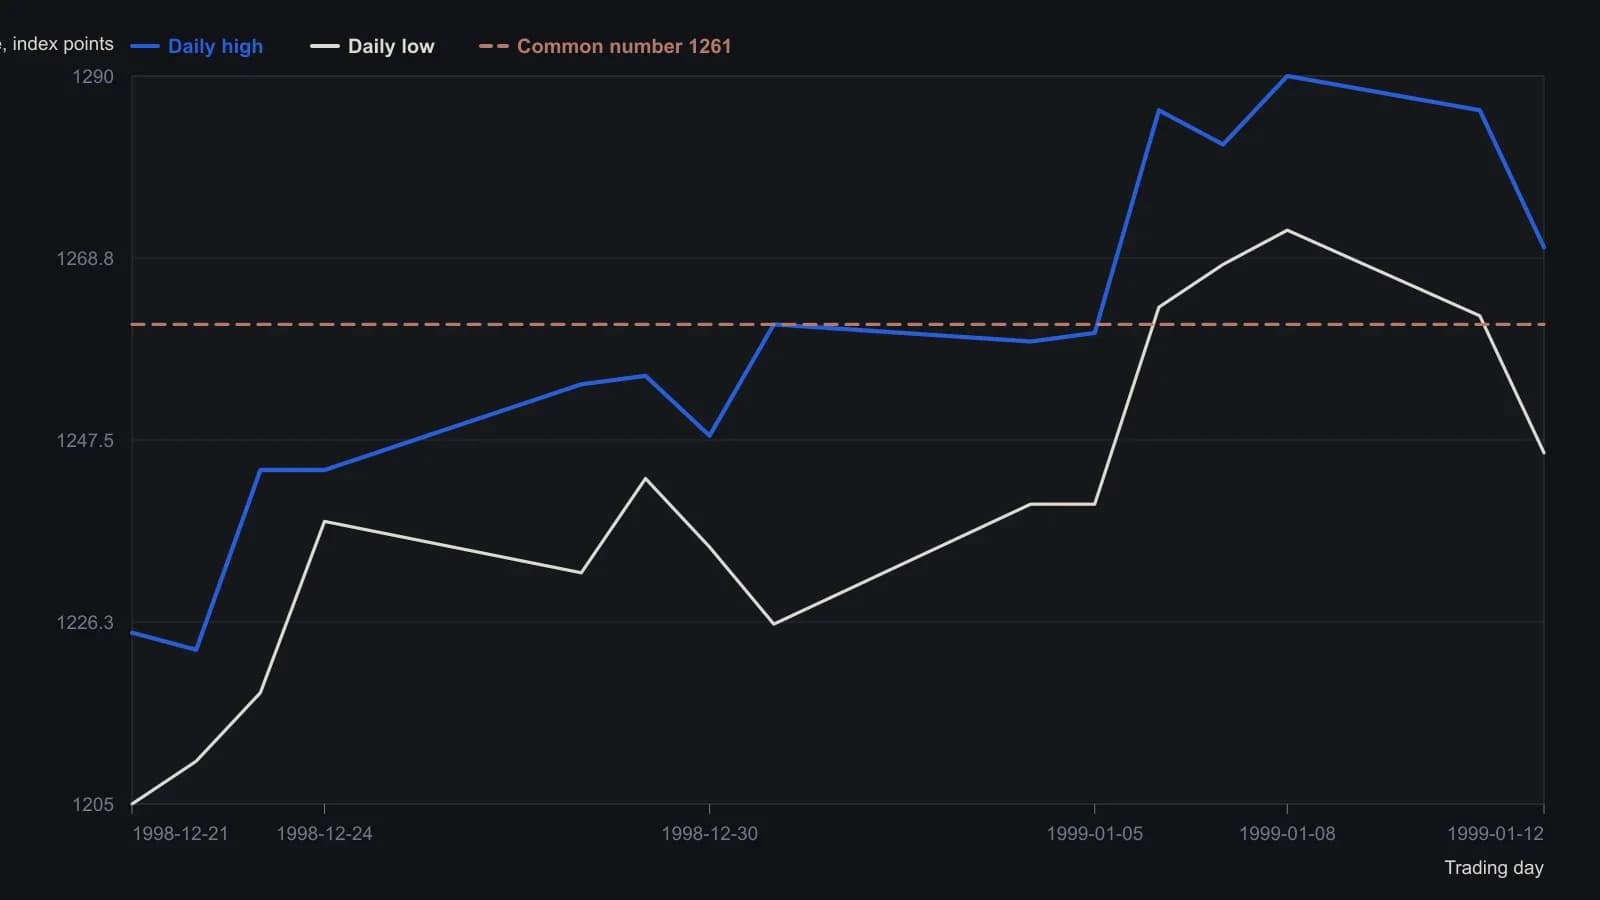
Each day's high and low are read from the printed high-low bars against a 10-point price scale, so values are whole index points with about a one- to two-point reading tolerance. The 1261 line is the author's drawn common number, not a stated print value.
Stop-loss and trailing stop on the same map
A stop-loss for a trade taken at a common number is placed a few ticks on the far side of that number. If the number is taken out, the next higher or lower common number is treated as the expected destination.
The next common number is used as the first objective. A trailing stop is advanced as price approaches that objective so remaining exposure stays bounded if the move stalls. The destination number can also start an opposite position.
All readings on this track · 36 readings
- 1988Half-day bars, a midpoint gate, and a bar-based trail
- 1989Packaging two-bar reversals into testable entry and exit rules
- 1989Weekly high and low averages as stop-and-reverse levels
- 1991Constant false-alarm rate for dominant-cycle stops
- 1992Tick-index extremes as continuation and turn hypotheses
- 1993Constructing layered stops from equity and structure
- 1993Filter crossovers with moving-average slope
- 1993Precommit stop bounds from equity and structure
- 1998Evaluating a trendline barrier that can only tighten a capped stop
- 1999Constructing common-number support and resistance
- 2001Four-step opening-hour bias and trailing stops
- 2004Make the trading system the star
- 2005A beginner stock case: stop, trail, and the pre-trade checklist
- 2006Sell stops that trail support after the buy
- 2006Treat a wave-3 label as unfunded until the stop rails are written
- 2008Test medium-term divergence with a trendline break and a trailing stop
- 2010Rule-based forex entry, stop and trail
- 2012Precommitting stops when one currency range templates another
- 2012Cat-ears as a downtrend continuation hypothesis
- 2013Three-average swing entry and a trailing average exit
- 2014Construct a dual quotient-copy trend filter under a frequency roof
- 2014Stop distance, size, and trailing swing invalidation
- 2014Long-only RSI pullback, reversal-bar-entry, and staged-trail construction
- 2015Dual-average regime, trigger candle, and trail as one daily script
- 2015Three-gate trend system: filter, trigger, and trailing stop
- 2016Construct HHLLS crossover and breakout entry rules
- 2017An appointment-trade around a scheduled political close
- 2017Golden-cross breakout rules for a swing entry
- 2017Breakout confirmation above round numbers, with nines as sell shelves
- 2018Classify diamond geometry before the breakout
- 2019When trails and stops betray the support read
- 2019One-triggers-the-other pairs for preplanned swing entries
- 2019One-triggers-the-other orders for a breakout and its stop
- 2019When the second decision unbounds planned risk
- 2020Last-Hour Breakout With a Same-Session Flatten
- 2020Couple the slow period to stop-loss and trailing-stop settings