1992issue C121-7
Tick-index extremes as continuation and turn hypotheses
An extreme tick-index print can support continuation or a turn, depending on where the close sits, whether the candlestick real body is compressed, and whether a trailing stop is already live. This case walks the stated market-breadth rules through December 1991 and April 1992 Standard & Poor's futures sessions.
- The tick index is a market-breadth count of issues last trading on an uptick minus those last trading on a downtick, and an extreme print is only a proposed cue.
- A close near the day's high or low with an intraday extreme above 600 is a continuation cue, while a narrow open-to-close span with the same extreme is a turn hypothesis.
- When a session meets both a breakaway confirmation and a turn warning, the archive workflow tightens the protective stop and follows the next session's direction.
- A later high can print without a tick-index flag, which is why a trailing stop stays attached after held-gain sessions.
What the tick index counts
The tick index is defined as issues last trading on an uptick minus issues last trading on a downtick. A session with 500 upticks and 250 downticks produces a reading of 250. That net count is a market-breadth snapshot of how many issues are printing higher versus lower on the latest trade.
An intraday-extreme is a reading beyond a stated threshold during the session, used as a proposed turn or continuation cue. The closing-tick is the same count at the session close, read separately from any extreme printed earlier in the day.
Double extremes and four operational rules
A documented double-extreme setup treats two intraday readings of 600 or more downticks at roughly the same Dow Jones Industrial Average price, at least one day and no more than 10 days apart, as a buy condition at a double bottom. The mirrored pattern of 600 or more upticks is the sell condition at a double top.
Four operational rules were stated. An intraday tick extreme above 600 plus a close near the day's high or low is a continuation cue. A narrow-range-session, meaning a day whose open and close sit close together, plus ticks above 600 is a likely turn. A closing-tick above 600 is a near-term turn warning. Breakaway sessions from highs or lows usually printing above 500 are treated as reversal confirmation, a breakaway-print that direction has changed.
The December 1991 sequence
In the December 1991 June Standard & Poor's futures sequence, a 670 downtick session was treated as an intraday buy under the narrow-range-plus-extreme-tick rule. The next session gapped up with 860 upticks and a compressed open-close range. That created a rule-conflict between breakaway confirmation and a turn warning. The archive workflow handled the conflict by tightening protective stops and following the next day's direction.
Later December 1991 sessions were read as continuation when price advanced freely on still-elevated upticks: more than 10 points on 610 upticks, then a five-point gain on only 620 upticks. The tape was then read as a stalling top when a close of 660 upticks was followed by a 1-1/2-point open-close range with a 796 closing uptick print.
NYSE tick extremes through the December 1991 June S&P rally
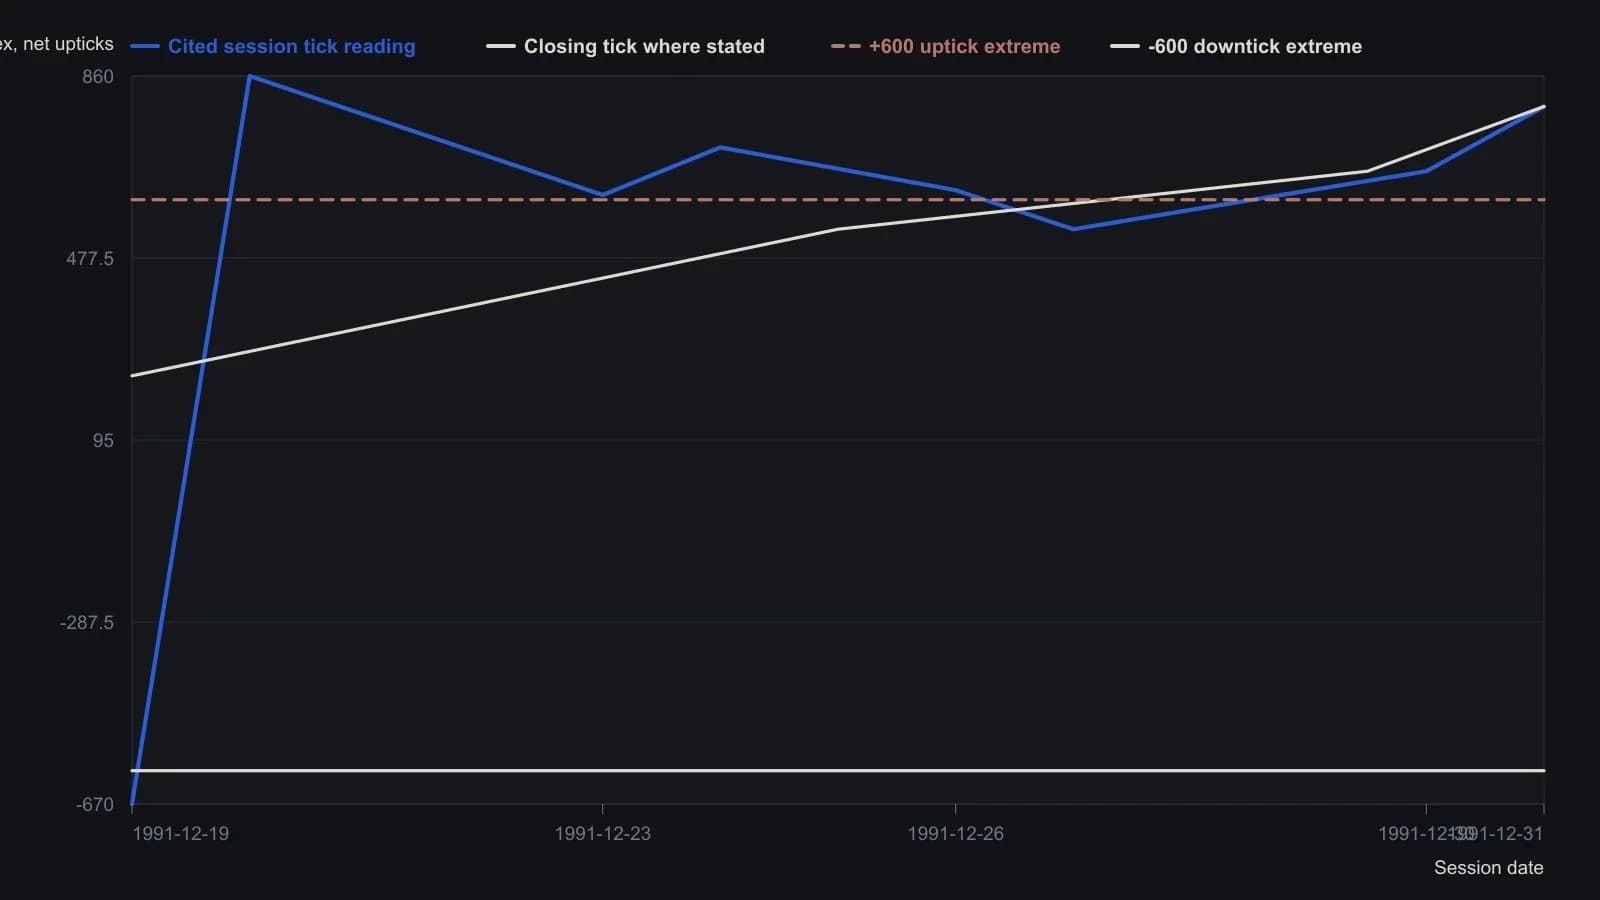
Each primary point is the tick reading named for that session (intraday extreme unless only a close is given). The 30 December 660-uptick close is the rally the source places between the 27 December (F) and 31 December (H) letters. The ±600 lines are the extremes used in the four operational rules.
The April 1992 low and a silent high
The April 8, 1992 low printed 1,000 downticks with a fairly narrow open-to-close range and was treated as a reversal under the narrow-range rule. The next session's 750 upticks and eight-point close that held its gain was not treated as an impending top.
After further April sessions that held gains on 920 and then 1,000 upticks, the tick-index rules did not flag the subsequent high. A stop at the prior day's low would have exited on April 16 as the contract began to decline. The case cites that miss as the reason trailing stops stay attached to positions: a protective exit is raised or tightened after a signal or a held-gain session so a failed hypothesis has a predefined bound.
Candlestick body and shadows
The accompanying candlestick notes define the real body as the open-to-close span and the shadows as the high and low extensions. The body is unfilled when the close is above the open and filled when the close is below the open. The same open-high-low-close bar is usable from an intraday to a monthly scale.
Editorial: the compressed real body is the second layer of the three-layer check, because a narrow-range-session is a small open-to-close rectangle sitting under an extreme tick print. The first layer is where that close sits in the day's range. The third layer is the trailing stop that stays live when a rule-conflict appears or when the breadth tape never prints a flag at the high.
All readings on this track · 36 readings
- 1988Half-day bars, a midpoint gate, and a bar-based trail
- 1989Packaging two-bar reversals into testable entry and exit rules
- 1989Weekly high and low averages as stop-and-reverse levels
- 1991Constant false-alarm rate for dominant-cycle stops
- 1992Tick-index extremes as continuation and turn hypotheses
- 1993Constructing layered stops from equity and structure
- 1993Filter crossovers with moving-average slope
- 1993Precommit stop bounds from equity and structure
- 1998Evaluating a trendline barrier that can only tighten a capped stop
- 1999Constructing common-number support and resistance
- 2001Four-step opening-hour bias and trailing stops
- 2004Make the trading system the star
- 2005A beginner stock case: stop, trail, and the pre-trade checklist
- 2006Sell stops that trail support after the buy
- 2006Treat a wave-3 label as unfunded until the stop rails are written
- 2008Test medium-term divergence with a trendline break and a trailing stop
- 2010Rule-based forex entry, stop and trail
- 2012Precommitting stops when one currency range templates another
- 2012Cat-ears as a downtrend continuation hypothesis
- 2013Three-average swing entry and a trailing average exit
- 2014Construct a dual quotient-copy trend filter under a frequency roof
- 2014Stop distance, size, and trailing swing invalidation
- 2014Long-only RSI pullback, reversal-bar-entry, and staged-trail construction
- 2015Dual-average regime, trigger candle, and trail as one daily script
- 2015Three-gate trend system: filter, trigger, and trailing stop
- 2016Construct HHLLS crossover and breakout entry rules
- 2017An appointment-trade around a scheduled political close
- 2017Golden-cross breakout rules for a swing entry
- 2017Breakout confirmation above round numbers, with nines as sell shelves
- 2018Classify diamond geometry before the breakout
- 2019When trails and stops betray the support read
- 2019One-triggers-the-other pairs for preplanned swing entries
- 2019One-triggers-the-other orders for a breakout and its stop
- 2019When the second decision unbounds planned risk
- 2020Last-Hour Breakout With a Same-Session Flatten
- 2020Couple the slow period to stop-loss and trailing-stop settings